Introducing Explore: Every Metric, Broken Down Any Way You Like
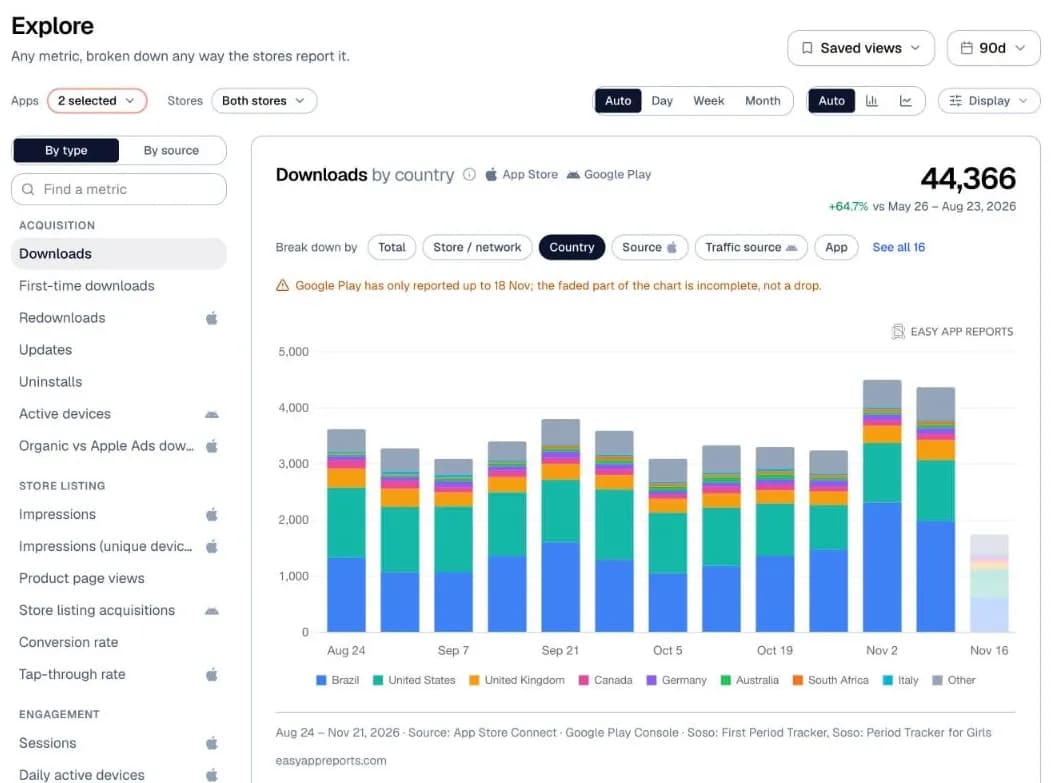
Every number you care about lives somewhere different. Downloads by country are in App Store Connect, install sources in Google Play Console, keyword spend in Apple Ads. Answering a simple question like "where did last month's growth come from?" meant opening three consoles and a spreadsheet.
That changes today. Explore puts any metric we collect on one big chart, with a table underneath, and lets you break it down whichever way the stores report it.
✨ Explore
Pick a metric, pick a date range, and Explore draws it. There are 72 metrics in nine groups, from acquisition and store listing to engagement, monetization, subscriptions, quality and reviews, plus Apple Ads and Google Ads. Metrics your account has no data for stay out of the way.
You can list them by what they measure or by where they come from (App Store, Google Play, Apple Ads or Google Ads), or just search for one.
🔍 Break It Down
Split any metric by the dimensions its store reports: country, source, page type, device, OS and app version, campaign, ad group, keyword, subscription, offer, cancellation reason and more. That's 37 ways in all. The most useful five show first, and "See all" shows the rest.
- Compare with the previous period. A dashed line shows how the same days looked last time.
- Leave values out. Click any row in the table to drop it from the chart and the totals, and click again to bring it back.
- Bars or lines. Explore picks the right chart for each metric, and you can switch.
- Saved views. Save any metric, breakdown, filters and dates under a name, and reopen it in one click.
📸 Made for Sharing
Every chart carries the Easy App Reports mark, the data source and the date range, so a screenshot is ready to post on LinkedIn or X, or drop into a deck. Prefer it clean? Turn the watermark off under Display.
🧭 Honest About the Data
Explore tells you when a store hasn't reported yet, when the last week or month is still incomplete, and when a breakdown comes from Apple's privacy-limited reports. A late store shows as a faded bar, not a drop.
🗂️ Also New
- Portfolio filters. Narrow Portfolio to one or more developer accounts, then to particular apps.
- Your settings are kept. Portfolio and Explore reopen the way you left them.
- More room for charts. The sidebar is slimmer and folds away with the arrow on its edge.
📊 Where to Find It
Open Explore from the sidebar at dash.easyappreports.com. The Installs, Uninstalls and Store views cards on Overview also link straight to their metric in Explore.
📌 A Few Things to Know
- Meta Ads isn't in Explore yet.
- Google Ads cost is shown in your ad account's currency. Store revenue is converted to USD.
- Apple leaves low-volume rows out of its detailed reports for privacy, so breakdowns such as source can add up to less than the total. Explore says so under the chart.
- When an app has a different name in each store, a breakdown by app lists it once per store.
- Your Portfolio and Explore settings are kept in your browser. Saved views are kept in your account.
- The first time you open Explore it can take a few seconds while we work out which metrics you have.
- It's included on every plan.
📬 Questions or Feedback?
Missing a metric or a breakdown you'd like? Let us know. We'd love to hear what you're exploring.
