This ASO Revenue Dashboard template is designed to answer one simple but critical question: how much revenue is your organic App Store traffic actually generating?
Instead of looking only at impressions, downloads, or keyword rankings, this template connects App Store Search and App Store Browse traffic directly to revenue, giving ASO teams a clear, business-oriented view of performance.
Built on Easy App Reports + BigQuery, this dashboard works across multiple apps and multiple developer accounts, and is fully filterable and ready for both high-level reporting and deep ASO analysis.
This template is intentionally rich in visualization patterns, so you can reuse or customize them easily:
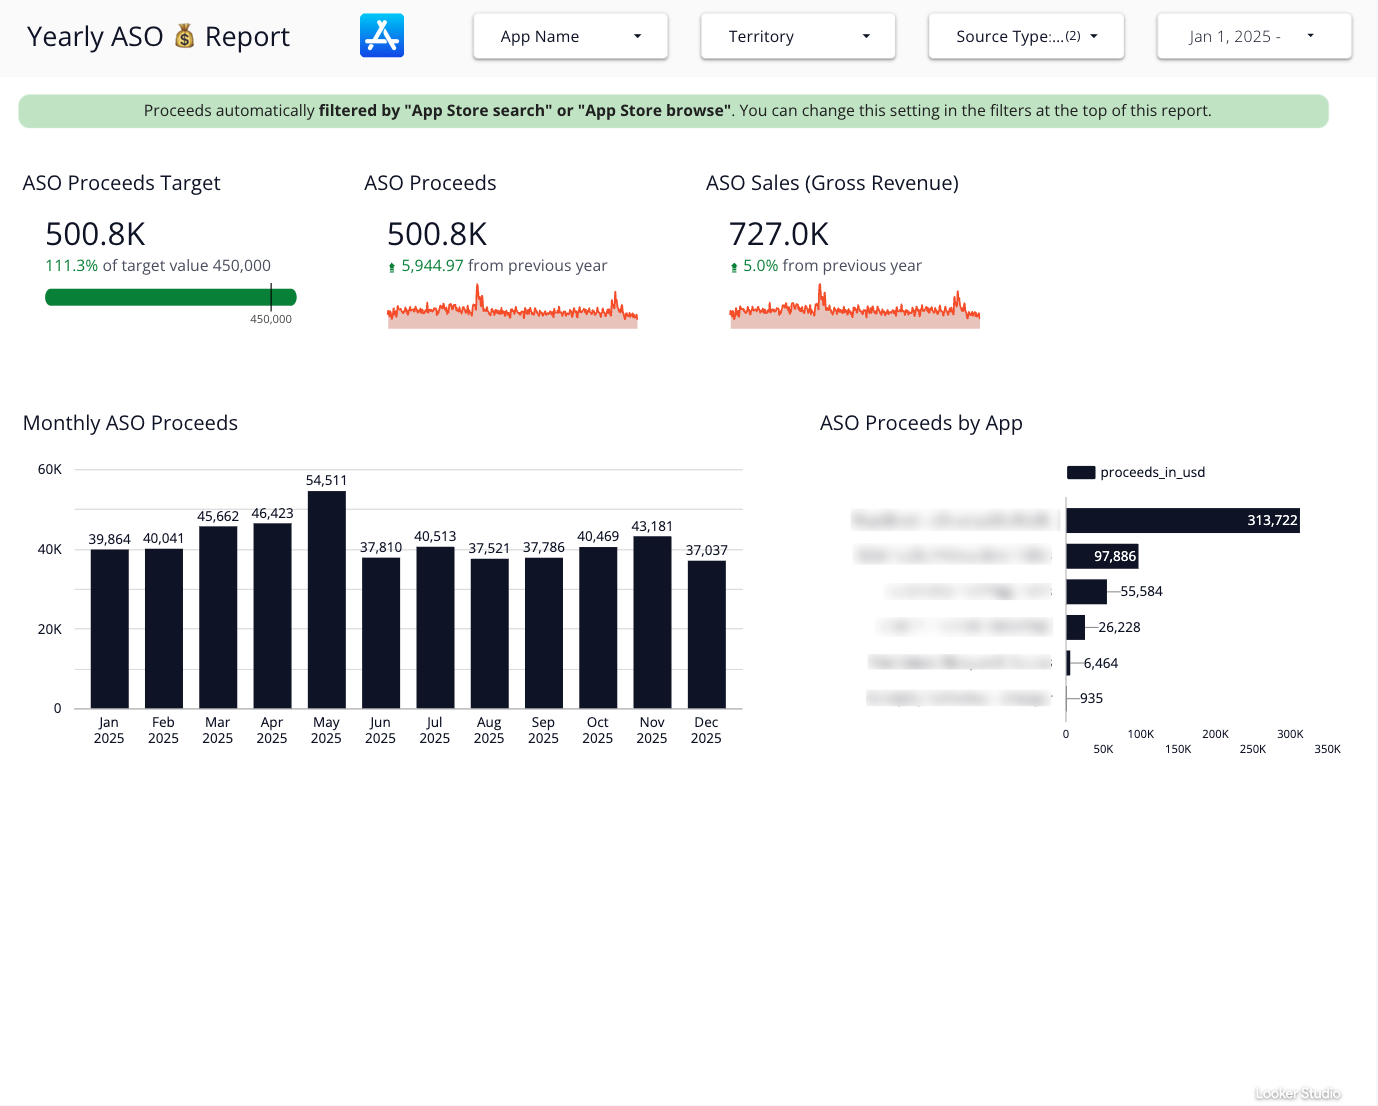
- Scorecards
- Total ASO proceeds
- Gross revenue
- Target achievement
- Year-over-year and period-over-period deltas
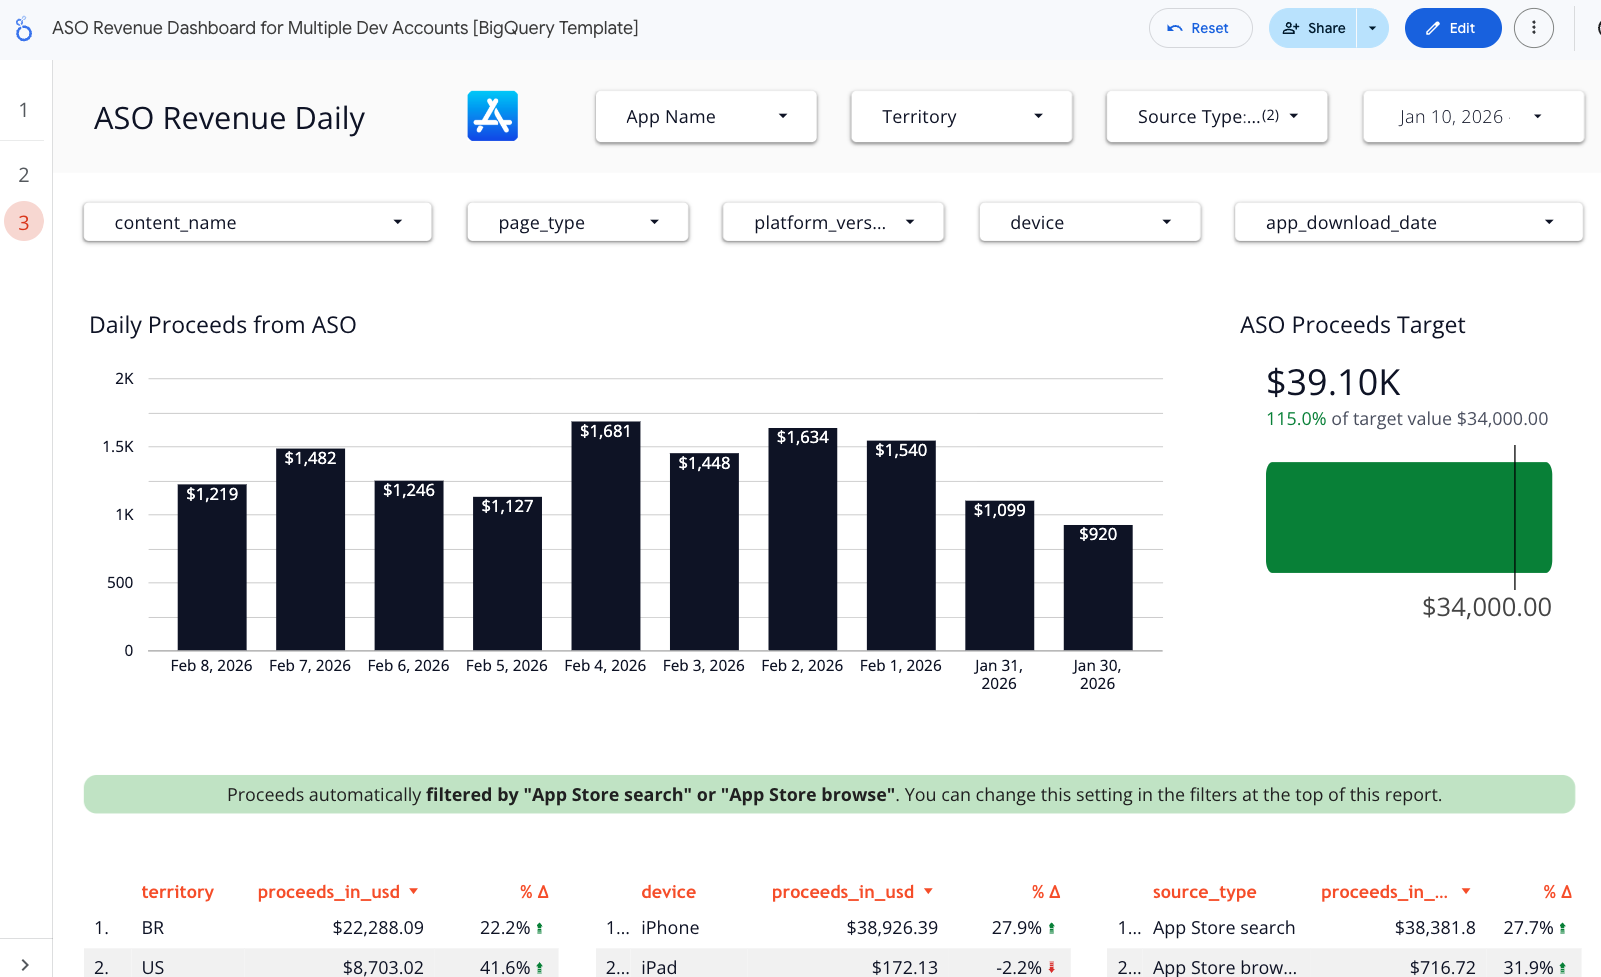
- Tables
- Revenue by app
- Revenue by country
- Revenue by device
- Revenue by source type
- Detailed daily transaction-level views
- Pivot tables
- App x source type (search vs browse)
- App x territory
- App x time (daily or monthly)
- Bar charts
- Total proceeds by app
- Monthly ASO revenue
- Quarterly ASO revenue
- Line charts
- Daily proceeds trend
- Revenue evolution over time
- Comparisons
- Day-over-day, month-over-month, year-over-year
- Target vs actual performance
Common use cases
- Prove ASO ROI
- Show exactly how much revenue comes from organic traffic
- Separate ASO impact from paid UA
- Search vs Browse analysis
- Understand whether your revenue comes from keyword optimization or featuring and browse traffic
- App portfolio management
- Compare ASO revenue across multiple apps and developer accounts
- Identify which apps deserve more ASO investment
- Market and localization decisions
- See which countries generate real revenue, not just installs
- Prioritize localization and keyword work based on revenue impact
- Daily ASO monitoring
- Detect revenue drops or spikes shortly after metadata changes
- Monitor volatility without waiting for monthly reports
- Executive reporting
- Replace spreadsheets with a live, always-up-to-date ASO revenue view
- Share a single source of truth with stakeholders
Why this template works well for ASO teams
- Revenue-first, not vanity-metric-driven
- Works across multiple apps and accounts
- Fully customizable and copy-paste friendly
- Bridges the gap between ASO, growth, and finance
If your ASO reporting still stops at downloads or keyword rankings, this dashboard is the missing layer that connects visibility to money.