
5 KPIs to Monitor Your App's Health with Easy App Reports
In today's ever-evolving digital age, keeping a close eye on the vital signs of your application is not just recommended, but necessary. A deep understanding of your app's health metrics ensures you stay competitive, address user concerns proactively, and tweak strategies for long-term success. And this is where Easy App Reports shines - turning complex data into actionable insights. Dive into these 5 essential metrics:
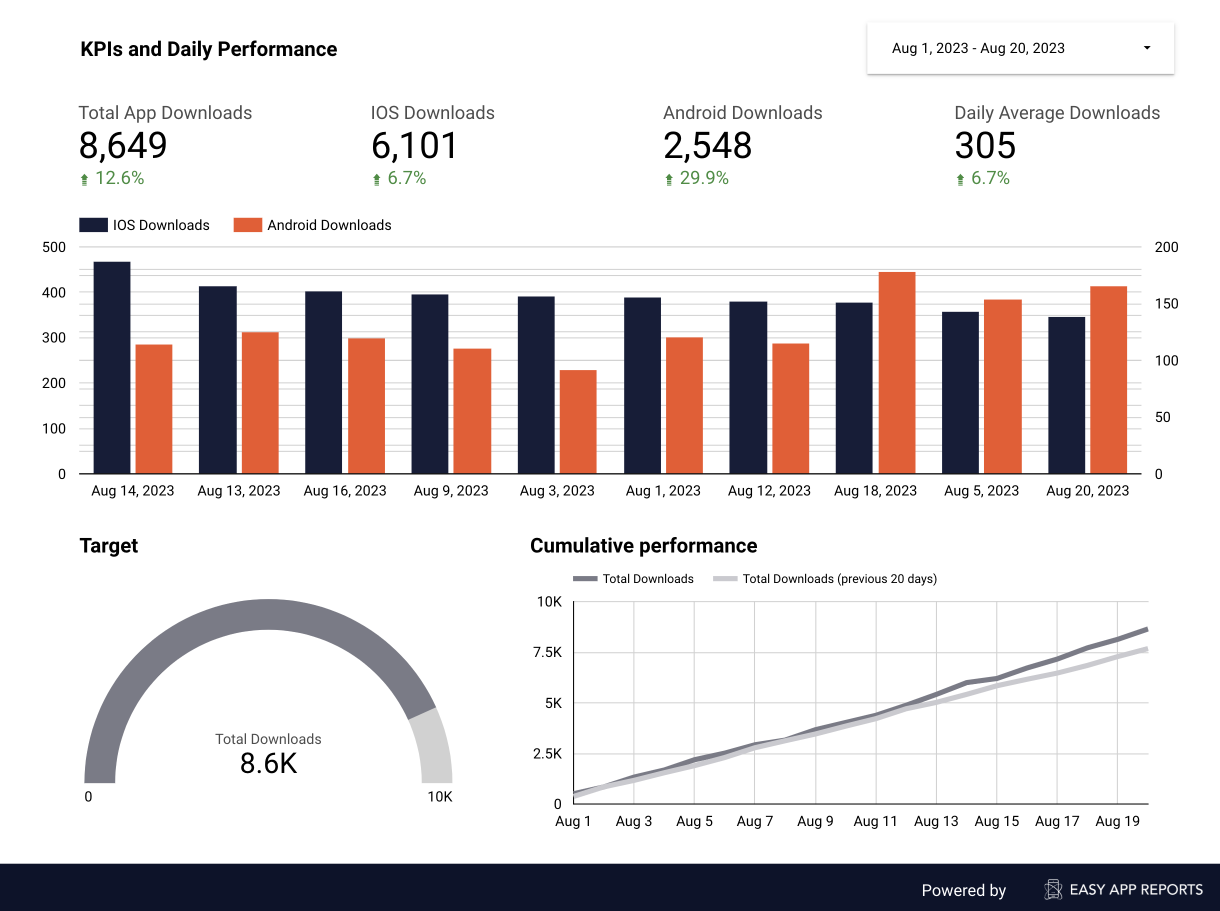
1. Downloads and Installs
An app's success begins with its ability to attract and prompt users to install it. Monitoring the number of installations provides an initial gauge of your app's appeal and the effectiveness of your promotional strategies. Whether you've recently rolled out a marketing campaign or made significant updates, tracking installation numbers allows you to evaluate the impact. Easy App Reports takes you beyond just raw numbers by offering insights into trends over time, geographical distribution of installations, and correlations with other KPIs. This broader perspective can empower you to refine your marketing and outreach initiatives to boost installations further.
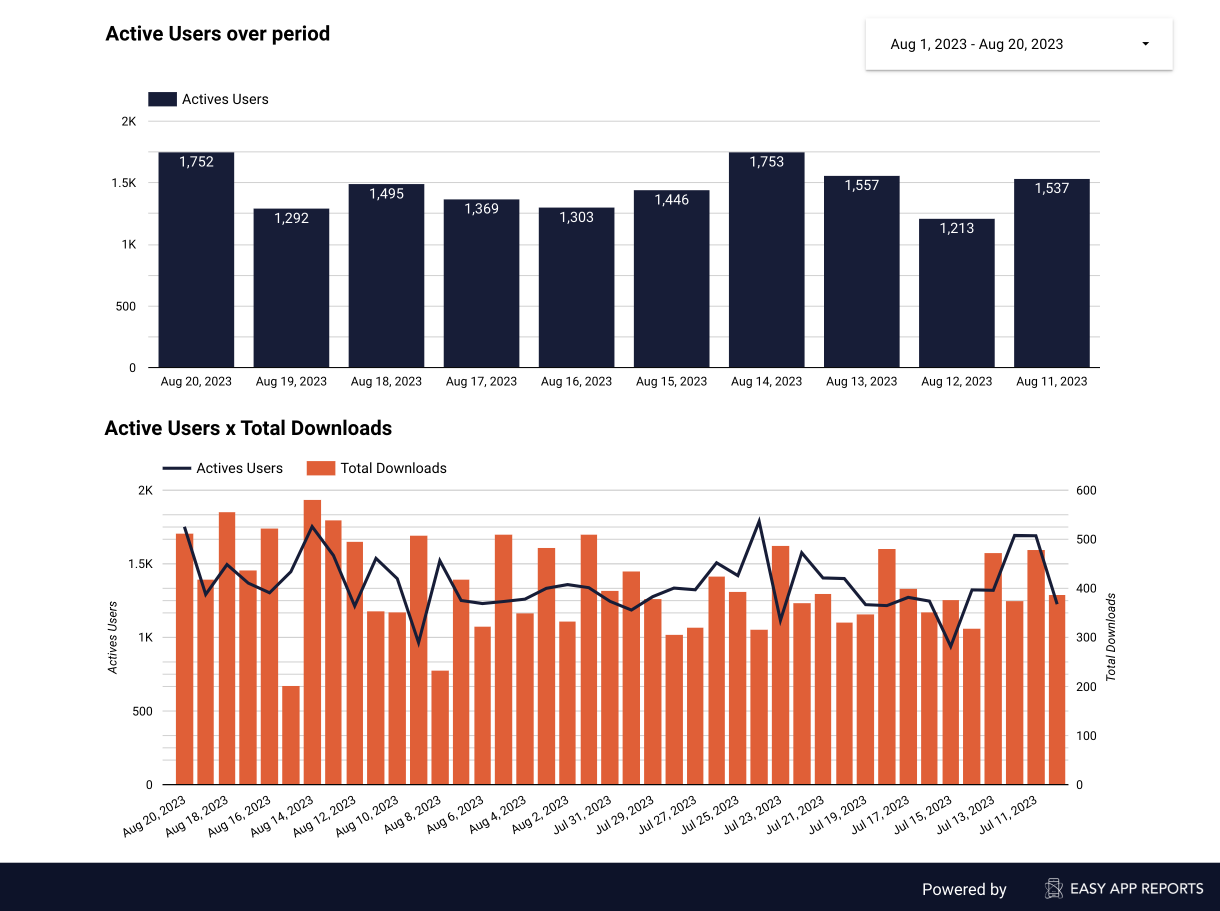
2. Active Devices
Beyond mere installations, understanding how many unique devices engage with your app over a certain period is crucial. Active Devices provides insights into the consistent value your app offers, ensuring users don't just download it but continue to use it. With Easy App Reports, you can gauge the number of active devices, discern patterns, and understand the depth of user engagement, enabling consistent user experience enhancement.
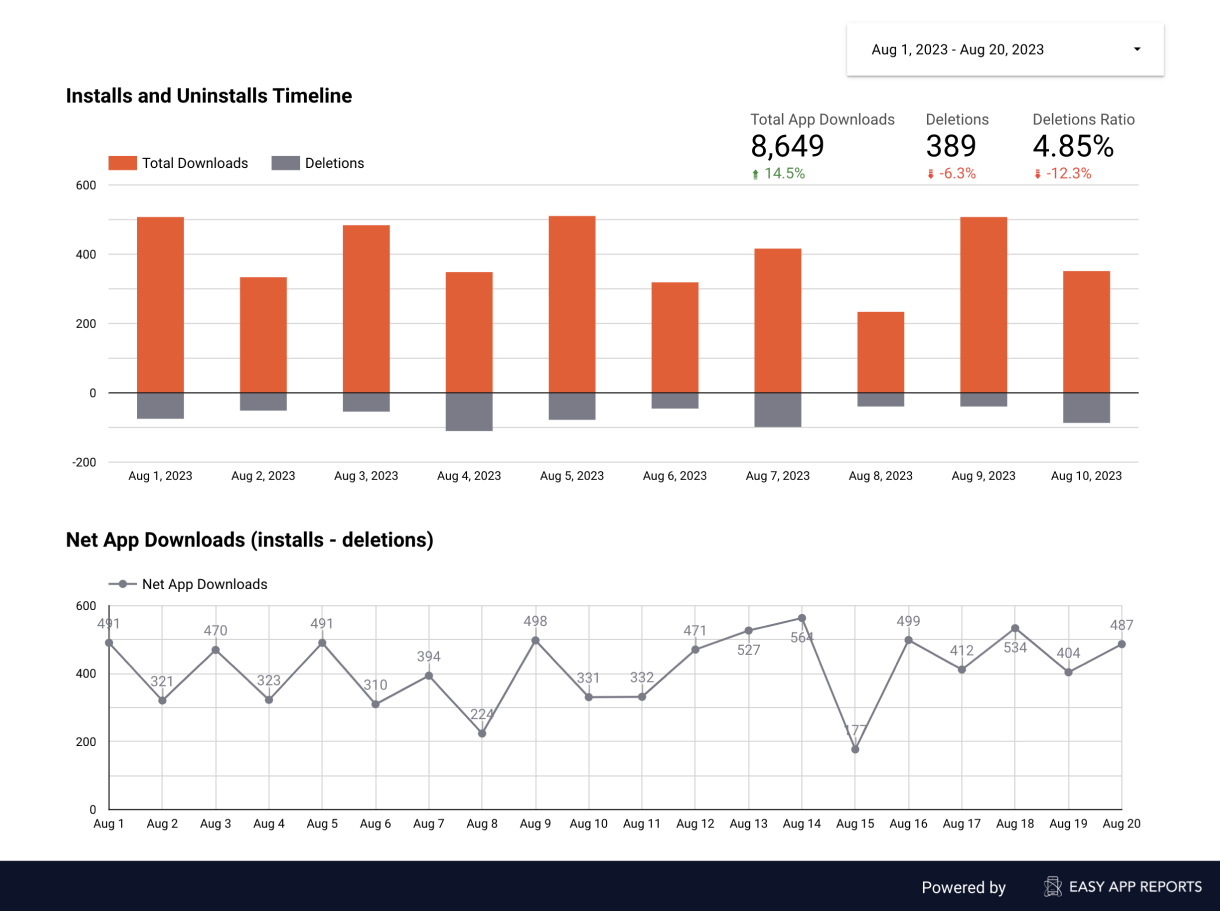
3. Uninstalls / Deletions
Uninstalls, or deletions, represent the number of times users have removed your app from their devices. Monitoring this metric is crucial as it can provide insights into potential issues or decreased relevance of your app. A spike in uninstalls might indicate problems with a recent update or emerging competition.
Fun fact: uninstalls are actually called Deletions by Apple.
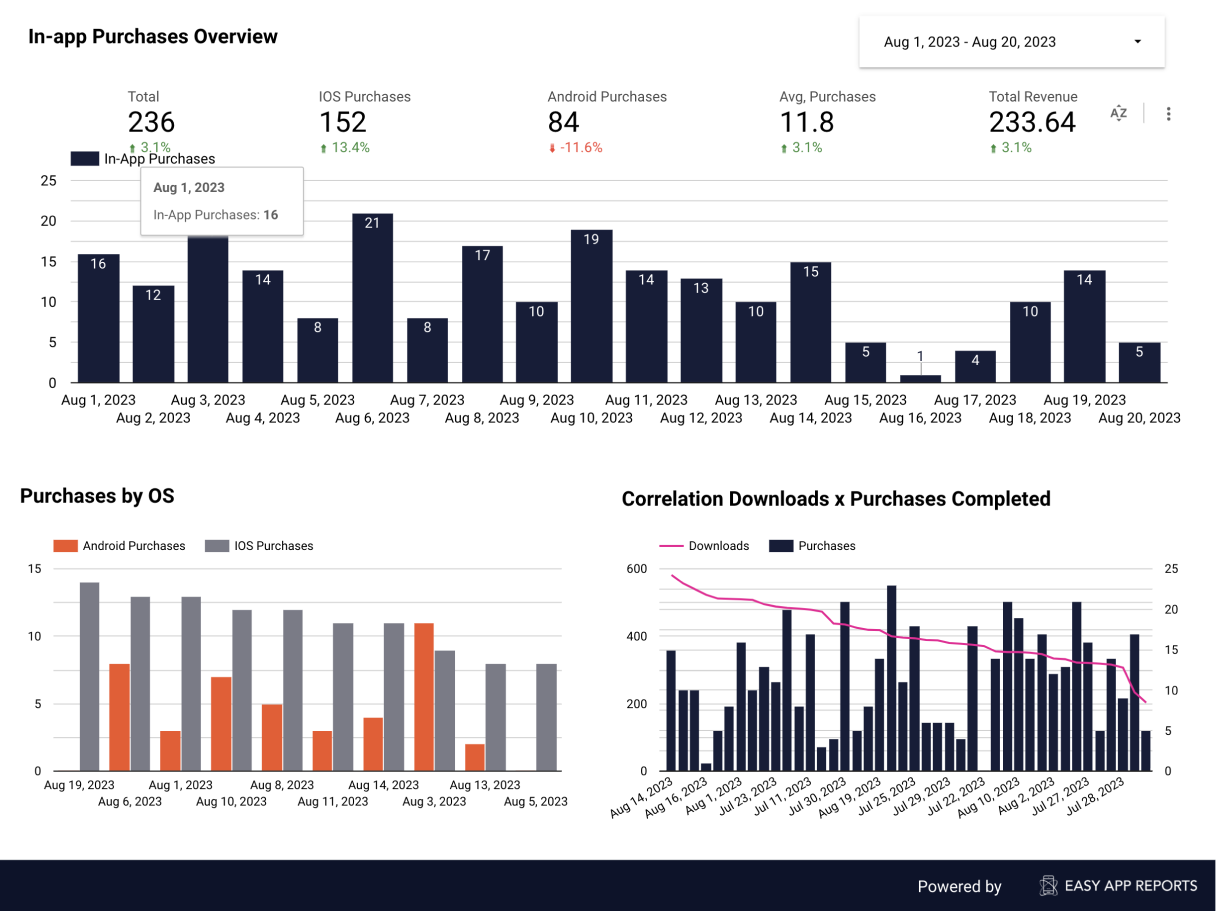
4. In app purchases
In the world of apps, where many monetization models revolve around in-app purchases, understanding user spending behavior is crucial. How often are users making purchases? Which in-app items or features command the most sales? Easy App Reports demystifies these patterns, offering a panoramic view of revenue streams, user spending habits, and potential revenue opportunities waiting to be tapped. With this granular knowledge, strategies can be recalibrated to maximize revenue and user satisfaction.
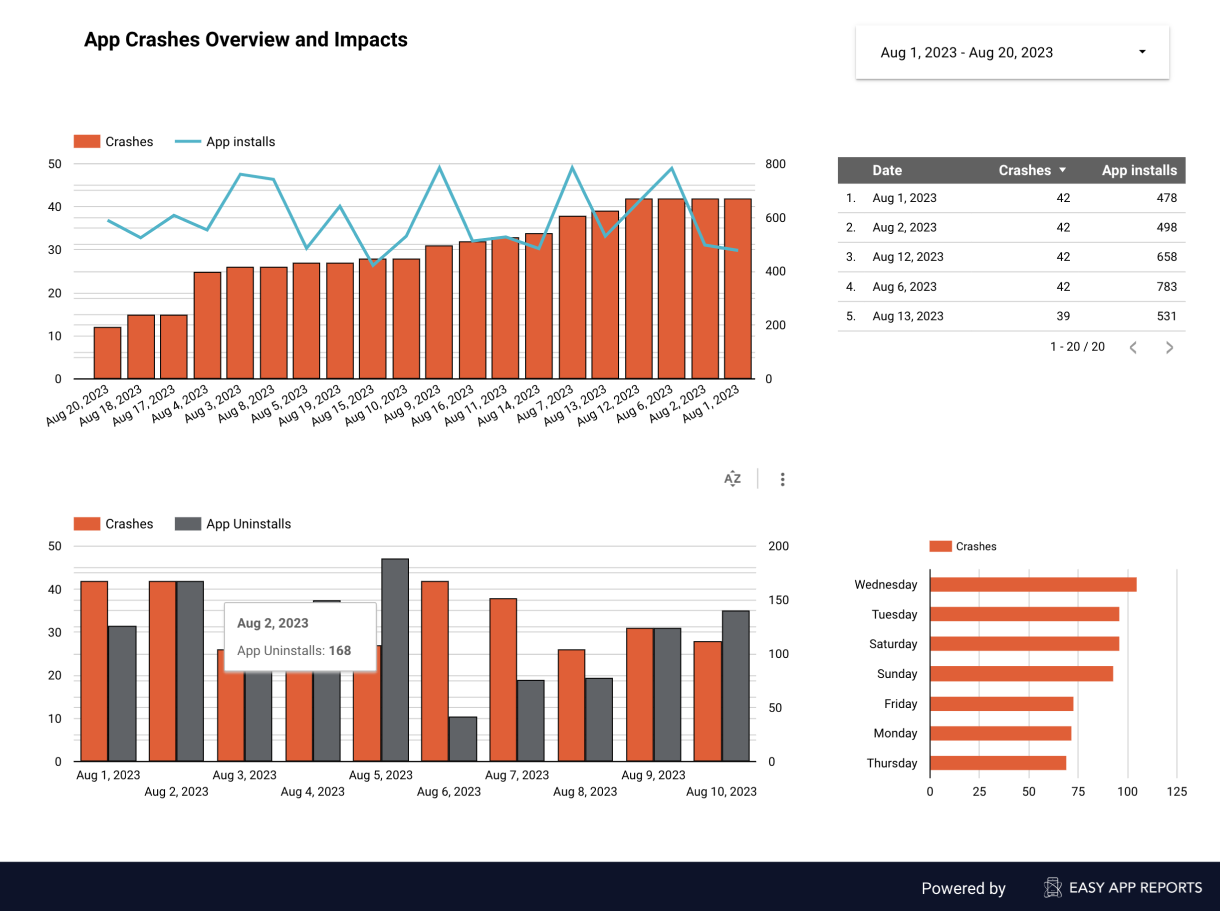
5. Crashes
In the realm of digital interactions, nothing dampens user enthusiasm faster than an app that crashes. Ensuring your app runs smoothly and reliably across different devices and operating systems is paramount. Crash reports offered by Easy App Reports delve into the specifics of each malfunction, from user journeys leading to the crash to potential bugs in the code. With this data at your fingertips, you're better equipped to implement fixes, enhancing user trust and overall app ratings.
---
Pairing the power of these KPIs with the comprehensive insights offered by Easy App Reports sets the stage for your app's robust health and longevity. Embrace the clarity, make data-driven decisions, and watch your app thrive.