AppTab: Your App Data, Right There When You Open a Tab
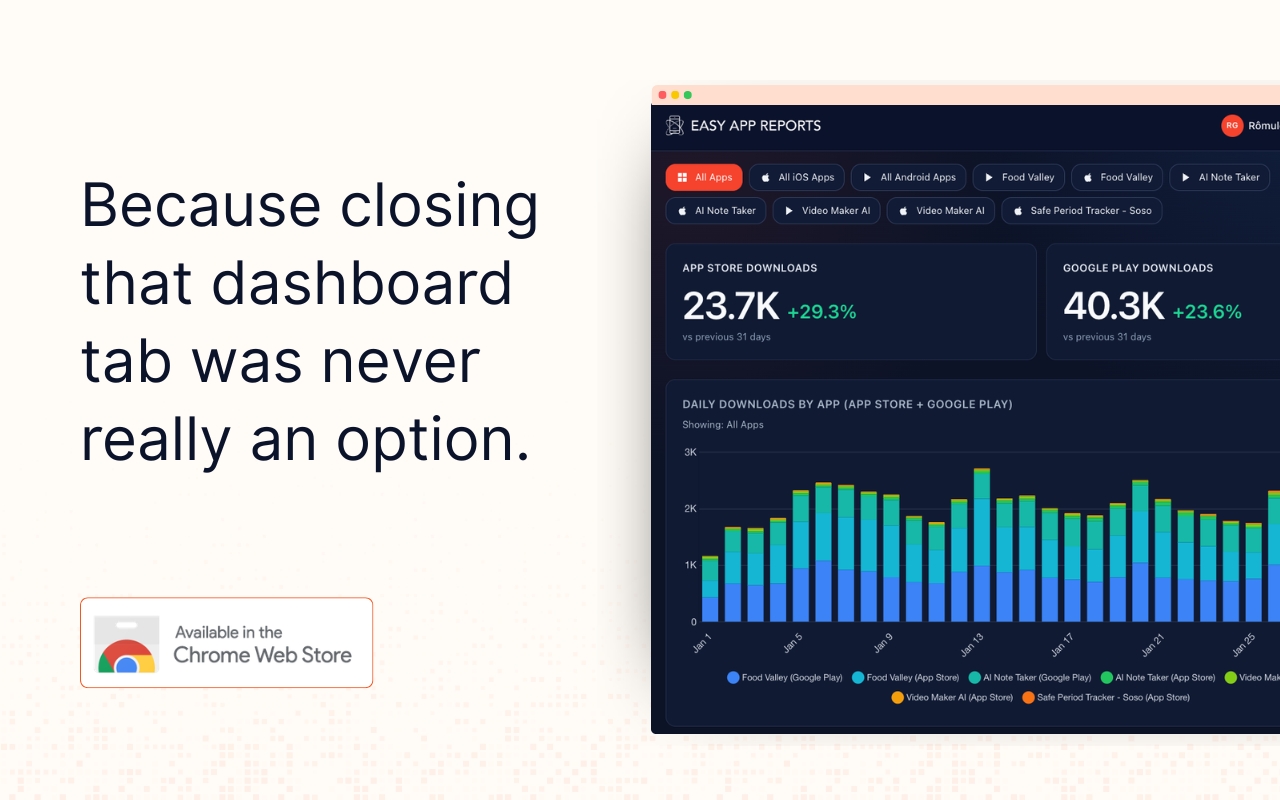
AppTab is a Chrome extension that surfaces your App Store and Play Store data directly in Chrome's new tab page.
April 20, 2026
New Features
Discovery & Engagement is here, but there's more coming.

As for today you can start exploring the first of the five reports from the App Store Analytics API: Discovery & Engagement for Looker Studio.
This is the final step towards automating all your App Store data - and deprecate our Chrome Extension in a near future.

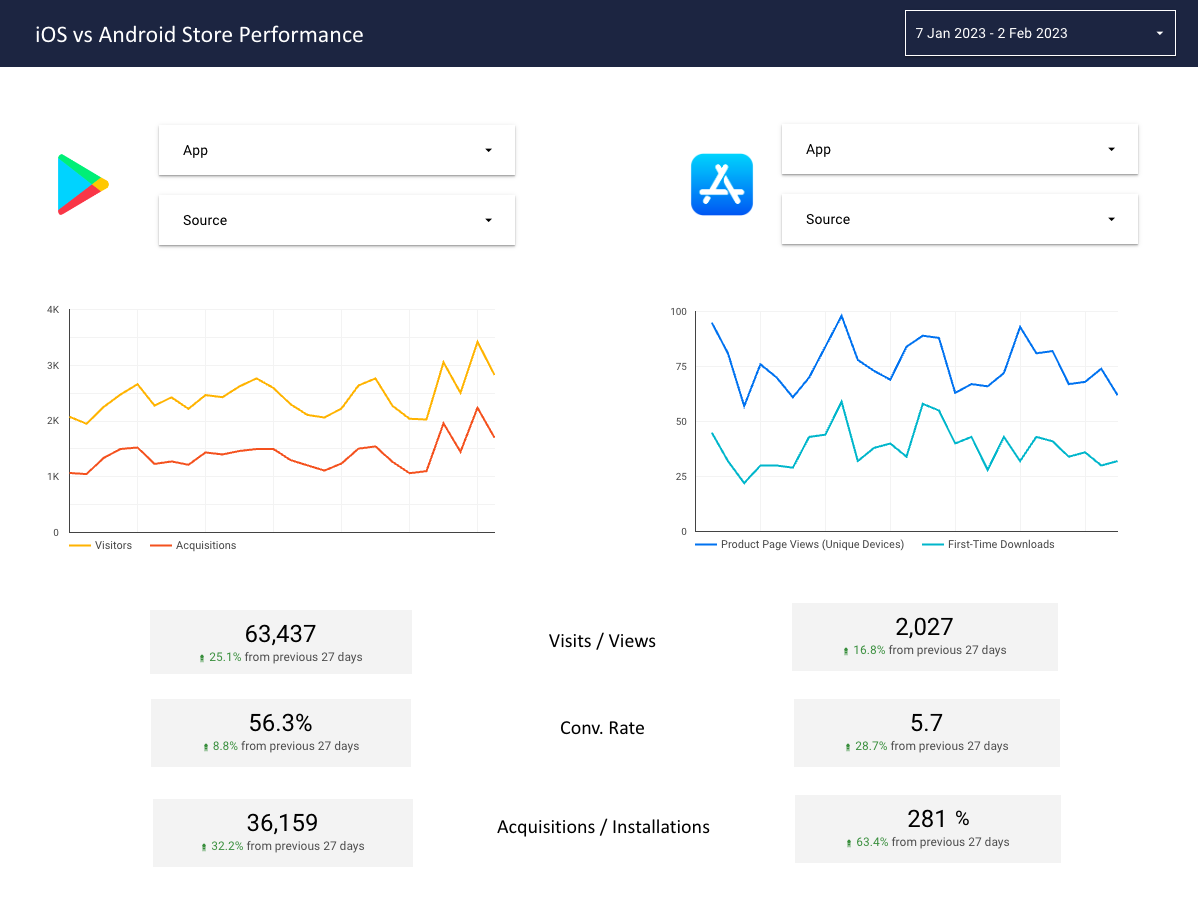
It contains: Impressions, Product Page Views, and Taps (that's new, right?).
Here comes the twist, though: you can filter it by Source, Page Type/Title, Country, Device, and more... All at the same time! Hello multi-dimensional filters!
Analytics datasets are 2.2x heavier than Trends.
So just be patient when engaging with your data for the first time. It'll be downloaded, stored and cached, which does takes a while (1-2 min).
Happy you asked because that's what's in the next couple of weeks:

So the plan is now to add other reports (when we say "reports" by the way, think of it as a collection of metrics) in the coming week. Then BigQuery. Then content: new Magic Templates, articles, and videos.
We'll be back once more reports are available!