Separating ASA from Organic: How Applica and Easy App Reports Unlock Real ASO Impact
Before we start: who's behind this case study?
First, Applica: a full-cycle growth partner for mobile apps, helps leading B2C app companies scale by driving measurable results across product, organic and paid marketing, and monetization.
One of those companies is Drops, the language learning app that turned beautifully designed word games and mnemonic associations into a cult phenomenon, becoming the fastest-growing app of its kind worldwide.
Supporting the data side is Easy App Reports — a platform built by app marketers, for app marketers — that transforms App Store, Google Play, and Ad data into clear, automated dashboards for faster and smarter decisions.
The Challenge: separating ASO and ASA in the simplest possible way
Drops' challenge sounds familiar: they investing seriously in both ASO and scaled Apple Ads, so seeing a clean split between organic and Apple Ads would be crucial to understand what's working (or not working) on each channel.
The team was spending too much time exporting and reconciling reports in spreadsheets across ASA and App Store Analytics to estimate true organic performance by day, market, and app.
The tricky part is that App Store Connect lumps ASA into “Search” and “Browse,” inflating organic downloads and making all app marketer's lives a lot harder.
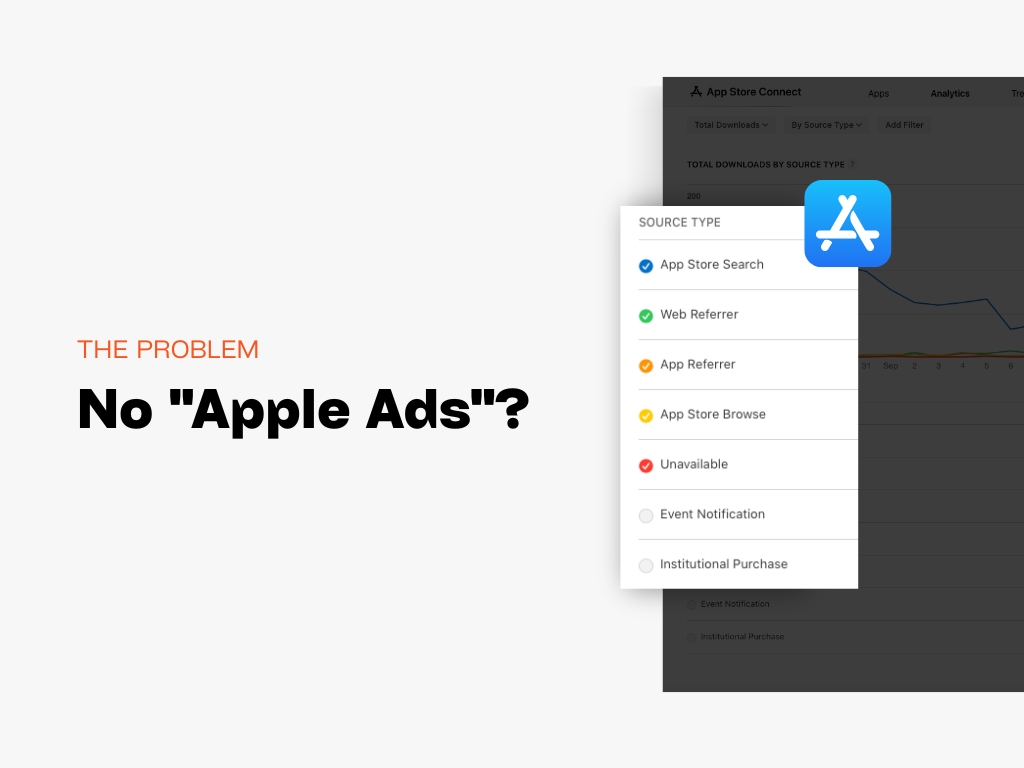
As a consequence, Drops couldn’t reliably answer basic questions like:
- “Did ASO changes improve organic?”
- “Are Apple Ads cannibalizing organic?”
- “And can we do that on a country-level?”
The Band-aid solution: manual work and CSV hell
The team was spending too much time exporting and reconciling reports in spreadsheets across ASA and App Store Analytics to estimate true organic performance by day, market, and app. This made it hard to measure ASO wins, spot cannibalization, or prioritize initiatives with confidence.
Fixing a complex problem with a simple solution
That's where Easy App Reports joins the scene. By enabling Drops to connect and merge both Apple Ads and App Store Connect data, now Applica automatically subtracts ASA installs from App Store “Search/Browse” totals—by day, week, month, app, country, and more.
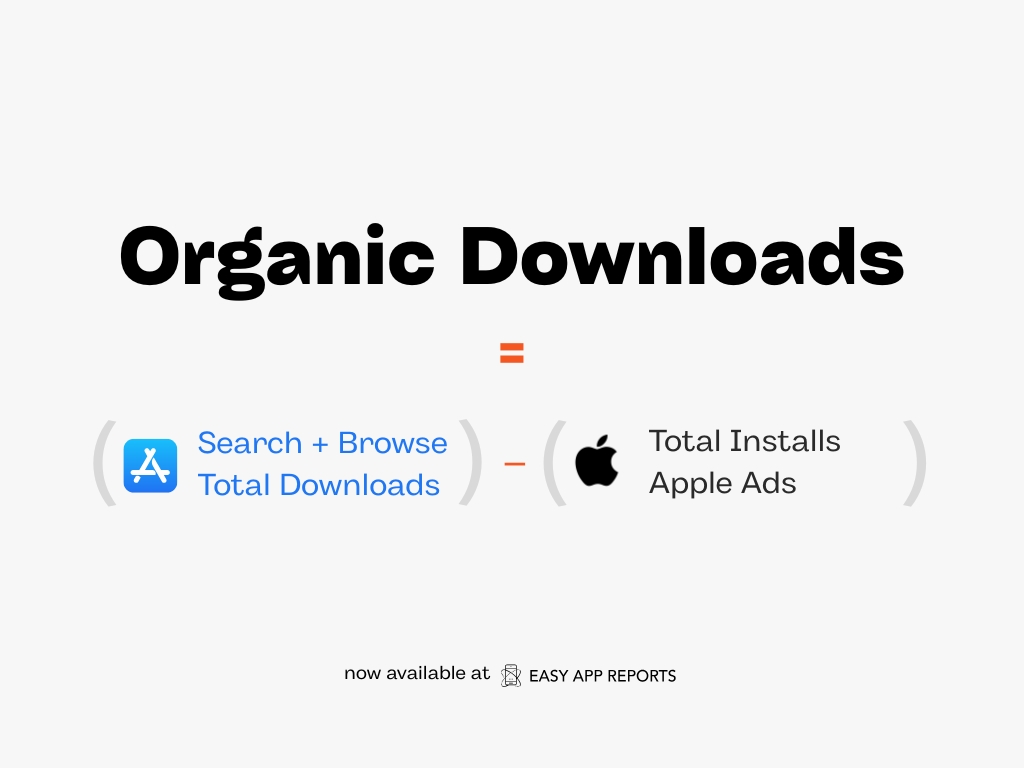
That gave Drops a true organic baseline to measure ASO wins, spot cannibalization, and fund ASA where it’s incremental.
The result?
- Clearer priorities;
- More confident budget decisions;
- and a faster testing loop—without touching a spreadsheet.
What does it look like on a real dashboard?
Applica and every other Easy App Reports customer have unlimited access to all our templates (or “Magic Templates” as we call them here).
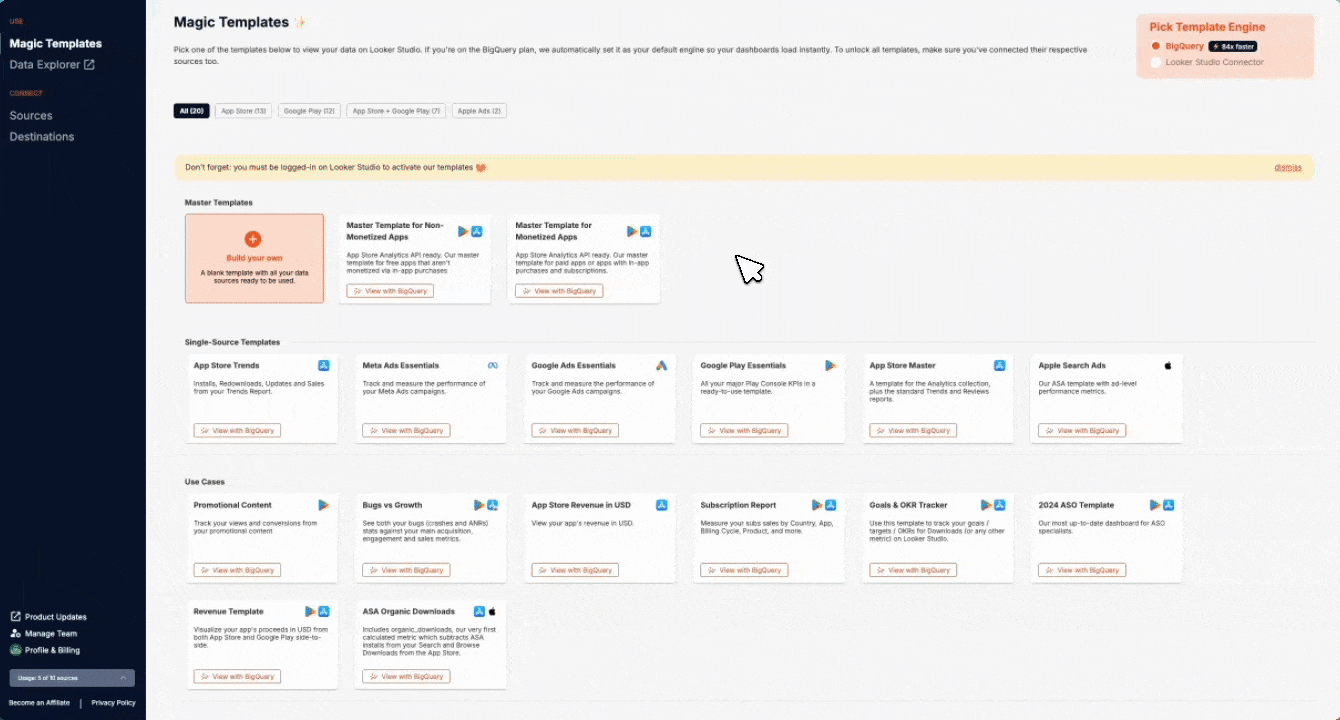
Easy App Reports’ Magic Templates feature: with a couple clicks and a few seconds you can get your Apple Ads and App Store Connect data under a single Looker Studio dashboard.
As you can see above, generating a ready-to-use dashboard is as easy on clicking on a couple buttons!
A few data visualization examples:
Visualize multiple metrics side-to-side with scorecards
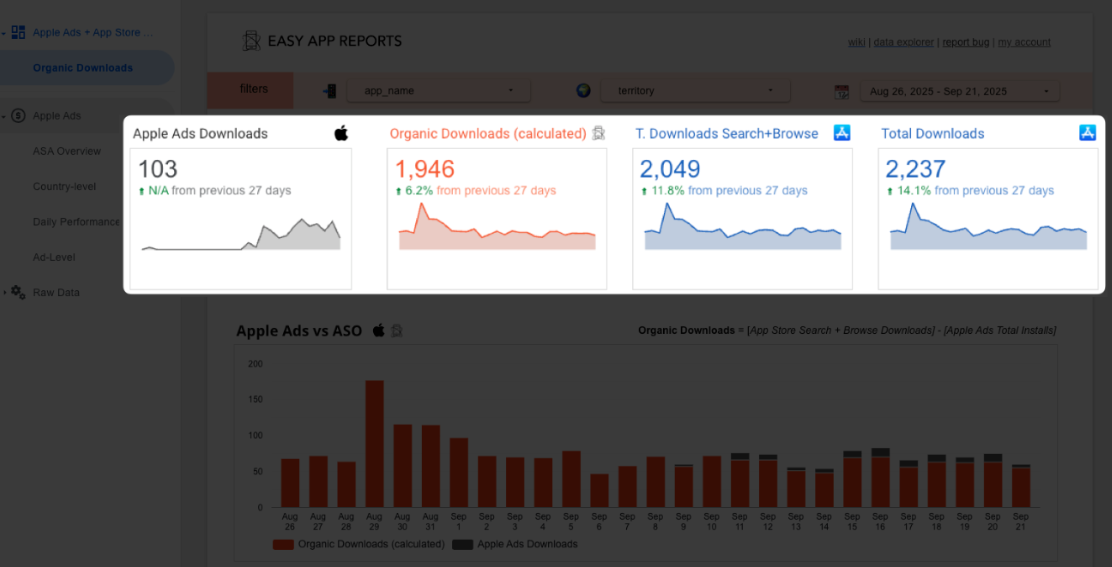
Easily compare key metrics at a glance — Apple Ads, calculated organic downloads, total search + browse, and overall installs — all in one row of scorecards.
ASO & ASA Downloads in a single chart
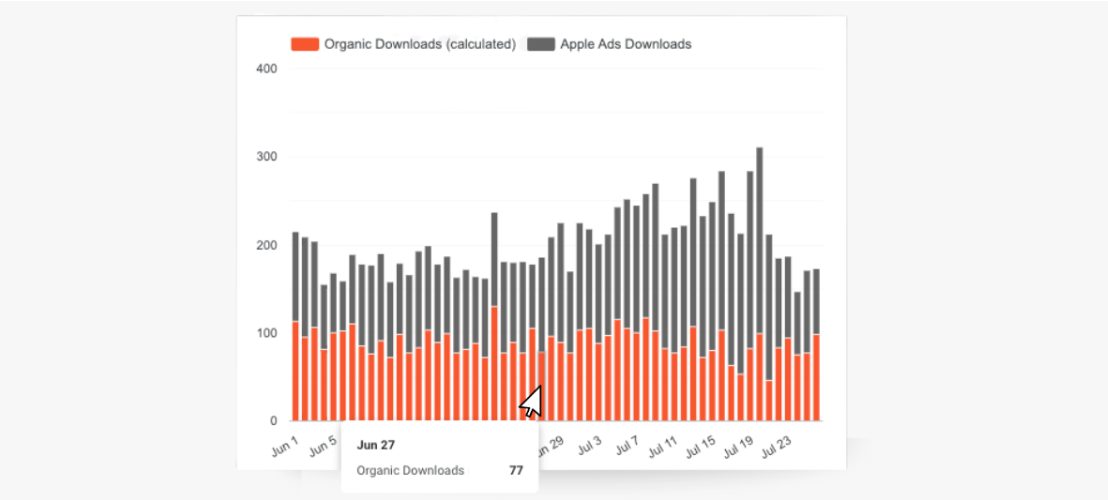
See how Apple Ads and organic downloads stack together in one chart, making it simple to spot trends and overlaps between paid and organic traffic.
Daily, weekly, monthly and 10+ aggregation dates
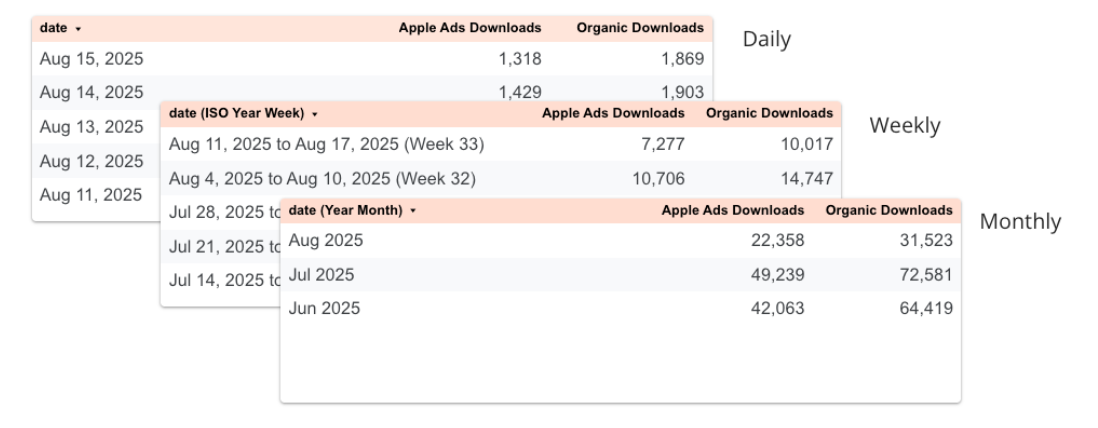
Drill into performance by day, week, or month with flexible time aggregations, so you can analyze results with the right level of detail for your reporting.
More ways to visualize country-level data
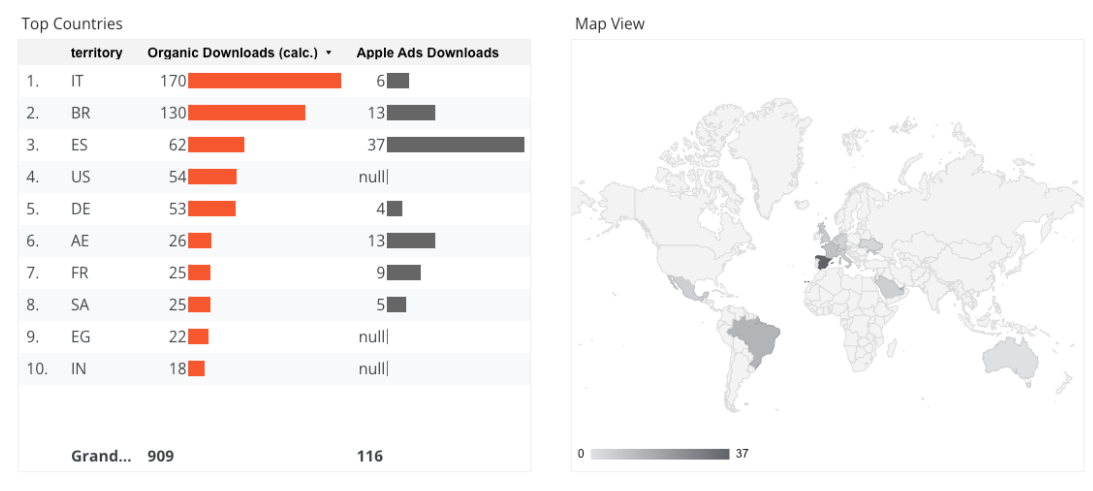
Go beyond totals by exploring downloads by country. View rankings, bar comparisons, and even a world map to see where growth is really coming from.
Tables, charts, scorecards, and more
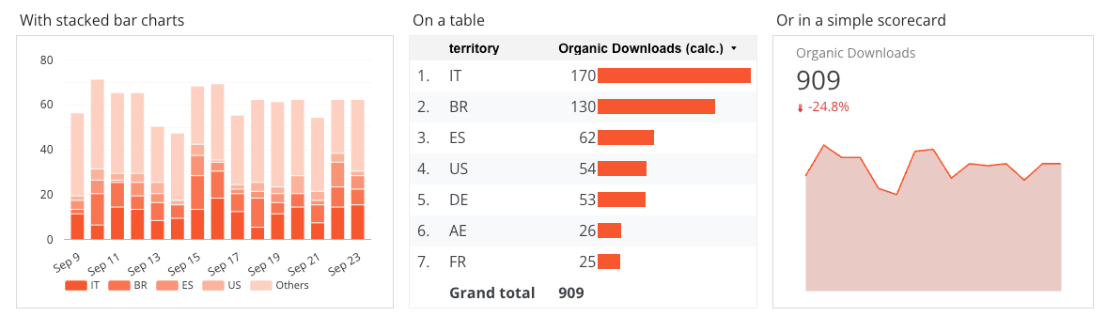
From tables to line/bar charts to pivot tables, there are plenty of options to choose from depending on how you prefer to visualize your data:
And don't forget: we also have all other Apple Ads, App Store Connect, Google Play, and Meta/Google Ads so this is really just the tip of the iceberg.
Behind the scenes: how EAR solved the ASA vs. ASO Data problem
Beyond connecting both App Store Analytics and Apple Search Ads into a single dashboard, we take the extra step of automatically separating paid from organic.
The method is simple but powerful: we subtract ASA installs from the App Store’s “Search” and “Browse” totals, leaving a clean organic baseline.
How It Works
On Easy App Reports you can connect both these data sources (Apple Ads and App Store Connect) with a few clicks.
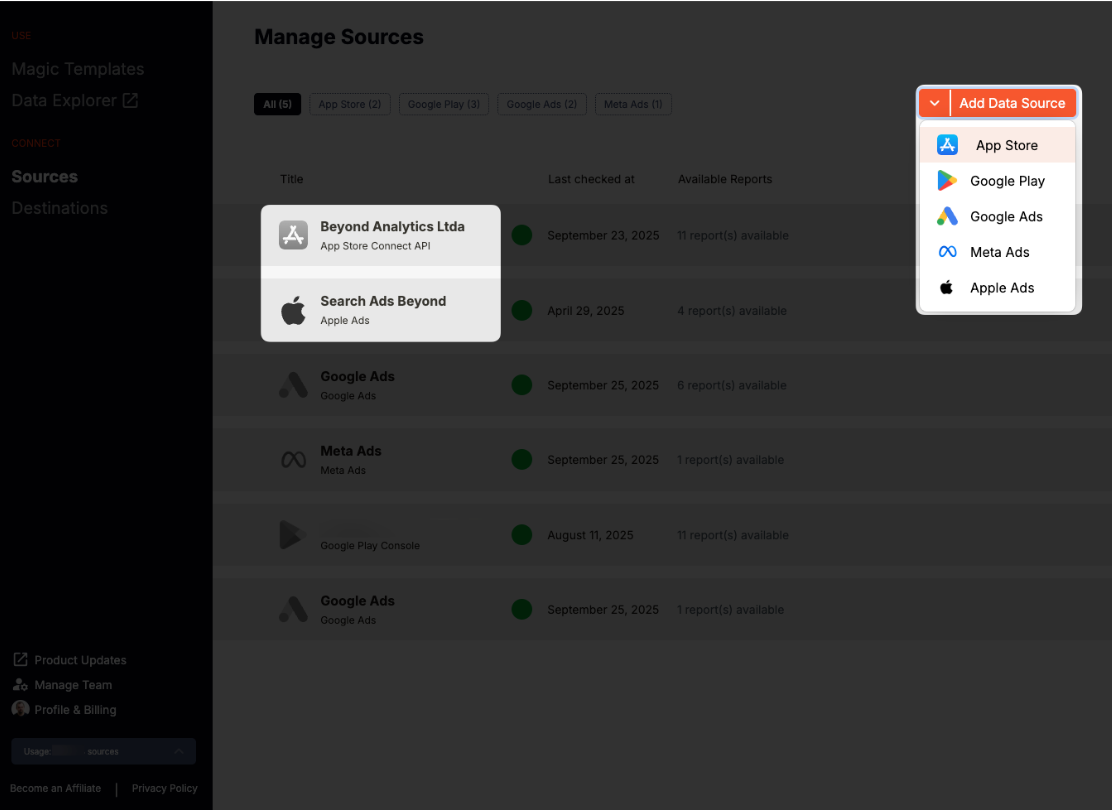
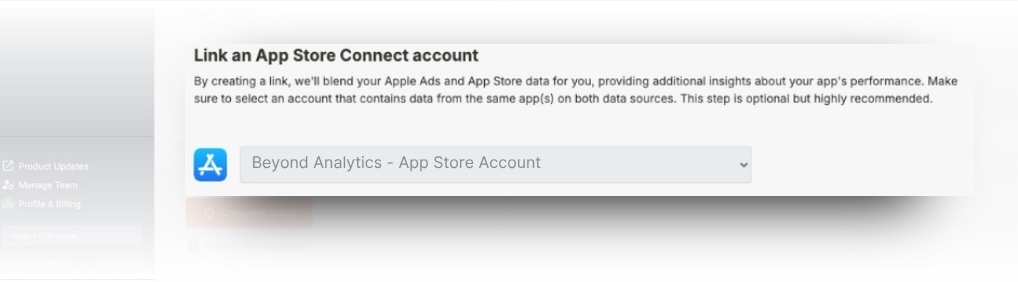
As EAR allows multiple data sources, you can then pick which sources you want to blend. The setup is as easy as selecting an account from a drop-down menu:
True Organic Downloads are automatically calculated by the Easy App Report's algorithm
With the data connected, an additional view called “organic_downloads” will be created under your BigQuery project:
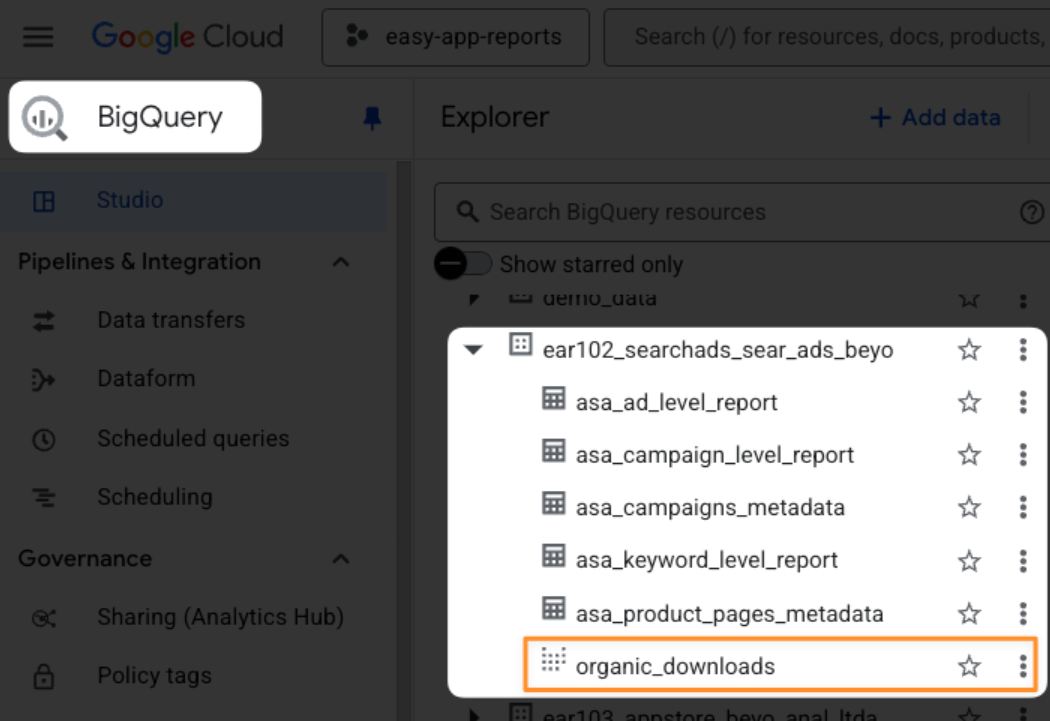
Everytime Easy App Reports receives new data from the App Store and Apple Ads, this table is also immediately updated to ensure everything stays up to date.
Then it's all about optimal data visualization!
Instead of guesswork, now you get a crystal-clear view of real organic growth broken down by day, app, and country. And to make reporting effortless, dashboards display all three columns side by side: Search+Browse, Apple Ads, and Organic.
Conclusion
By combining App Store Analytics and Search Ads data, Applica unlocked a new level of clarity for its clients — understanding exactly where downloads were coming from and how paid campaigns impacted organic growth. With Easy App Reports, this process became automated, consistent, and scalable across multiple apps and markets.
What used to take hours of manual work in spreadsheets is now available instantly in dynamic dashboards. For Applica, that means more time spent optimizing campaigns and sharing insights with clients — and less time cleaning up CSVs. This case highlights how a simple but powerful integration can transform reporting into a real growth advantage.
Extras
What's the upside on having a true organic baseline?
- Measure ASO impact with confidence: Separate real organic impact (metadata updates, featuring, keyword optimisation) from paid effects to prioritise the ASO activities that actually drive organic growth.
- Smarter budget allocation and ROAS: Identify cannibalization vs. incrementality so ASA budgets and bids are set where they add net-new volume at positive ROAS.
- Forecasting and seasonality: Clean organic baselines help forecast peaks, plan launches, and set realistic targets for free-trial and subscription funnels.
- Market-level decisions: Country and app-level accuracy reveals where organic is strong (lower ASA need) vs. where paid should do the heavy lifting.
Quotes from the teams involved
Drops
“The integration with Easy App Reports gave us a clean view of ASA vs. organic. Now we know what ASO really delivers, which channels drive incremental value, and where to scale spend. It’s simple, accurate, and saves us hours each week.” - Growth Marketing Team, Drops
Applica
“With clean numbers, we stopped guessing and can now understand when ASA is incremental. Campaigns work in sync with ASO efforts giving confidence to our actions. The setup took minutes and the data is always ready in our dashboards.” — Diana Daniuk, User Acquisition Specialist, Applica
Easy App Reports
“For too long, iOS app marketers found themselves in an awkward spot: they either had to guess their true organic numbers or spend countless hours in spreadsheets trying to piece it together. I’m glad we were able to solve this problem in a simple, SDK-free way. I can’t wait to see more ASO and UA teams using it to have a better understanding of their marketing channel mix.” — Rômulo Gomes, Founder, Easy App Reports
Want the Same Clarity as Applica and Drops?
Stop guessing your true organic numbers. With Easy App Reports, you can connect App Store Analytics and Apple Search Ads in minutes—no spreadsheets, no manual work.
👉 Sign up today to unlock your true organic baseline — or book a private demo so you can experiment it yourself.
And if you're looking for a data-driven agency, go to Applica's website.
--
Case study co-authored with Luisa Ronchi. Luisa has been in the app marketing industry for over ten years. She has worked with more than 40 apps across various niches and sizes, and has scaled marketing teams from the ground up. Currently, she’s at Applica, supporting world-class apps such as Slumber, Drops, AirHelp, DOGO, and many others with their organic and paid acquisition growth strategies.