
The Essential Starter Guide to App Store Connect Analytics - by Yuri Shub
Part 1 - Introduction
In the dynamic realm of mobile marketing, particularly after iOS 14's privacy updates, the ability to dissect and comprehend app performance data is paramount. Apple's App Store Connect, with its integral App Analytics feature, serves as an essential toolkit for developers and marketers.
This platform not only facilitates app publishing and performance tracking on the App Store but also offers a deep dive into analytics, including downloads, user interactions, and financials.
Are you looking for an easy way to visualize your App Store data on a beautiful and up-to-date dashboard? See how here.
App Analytics enables segmenting this data by traffic sources, providing a granular view of user acquisition channels. This capability is especially vital in a landscape where ad platforms' visibility into campaign performance is curtailed, pushing marketers towards the technical intricacies of SKADNetwork integration.
Understanding these metrics is indispensable for ASO (App Store Optimization) and UA (User Acquisition) strategies. It influences app discoverability and user engagement, driving informed decisions to enhance app growth and optimize marketing efforts.
This article aims to elucidate the process of analyzing install data within App Store Connect, underscoring its significance in today's mobile marketing ecosystem and offering insights into leveraging its analytical prowess for ASO and UA success.
Part 2 - Simplified Metrics Definitions in Apple App Store Connect
Building on our introduction to Apple App Store Connect and its critical role in mobile marketing, it's essential to understand the metrics that provide insights into app performance.
Apple categorizes these metrics into four main groups: App Store, Downloads, Sales, and Usage. For User Acquisition (UA) and App Store Optimization (ASO) efforts, the App Store and Download metrics are particularly pivotal, shedding light on how users discover and engage with your app. Sales metrics also come into play for apps featuring in-app purchases, offering valuable data on user spending behavior.
In the forthcoming sections, we'll dive deeper into analyzing these groups of metrics to unveil actionable insights for optimizing your app's presence and performance on the App Store.
Connect your App Store data to Looker Studio and BigQuery today. See how here.
App Store Metrics
Impressions: Think of this as the number of eyeballs glancing at your app in various App Store tabs. It's like your app's storefront window views.
Impressions (Unique Devices): This narrows down the views to unique shoppers; each device is counted just once, offering a clearer picture of individual interest.
Product Page Views: How many times users landed on your app's detailed showcase page, akin to customers stepping into your virtual store.
Updates: Counts how often your app has been updated by users, keeping it fresh and functional.
Download Metrics
First Time Downloads: The count of users who've downloaded your app for the first time, signaling new interest.
Redownloads: These are repeat downloads, indicating users who are coming back for more.
Total Downloads: The grand total of both first-time and repeat downloads, showing overall app traction.
Sales Metrics
In-App Purchases: This includes all the extras users buy within your app, from subscriptions to renewals, minus any restorations.
Sales: The total cash flow from app and in-app purchases, minus taxes and without considering Apple's cut.
Proceeds: What lands in your pocket after taxes and Apple's fees are subtracted from your sales.
Paying Users: The unique count of users who've opened their wallets for your app or its in-app offerings.
Usage Metrics
Installations: Every time your app finds a new home on a device, whether it's a fresh install or a family share.
Sessions: Each moment your app is actively used, even if briefly, counting multiple sessions if the app is revisited.
Active Devices: Devices that have engaged with your app at least once in a selected timeframe.
Active in Last 30 Days: Devices that came back for more app interaction within the last month.
Crashes: Not the highlight, but it counts the times your app unexpectedly closed on users.
Deletions: Tracks how often your app was removed from devices, offering insights into user retention challenges.
Calculated Metrics in Apple App Store Connect
After laying the groundwork with the basic metrics available in Apple App Store Connect, let's turn our attention to some key calculated metrics that can provide deeper insights into your app's performance. These metrics, particularly relevant for ASO (App Store Optimization) and UA (User Acquisition) strategies, help in understanding user behavior and app efficiency in converting views into tangible results.
Conversion Rate: Measures the effectiveness of turning App Store impressions into downloads. Calculated as Downloads / Unique Impressions.
Product Page Conversion Rate: Reflects the success of your app's product page in converting views to actions. It's Downloads / Unique Page Views.
Sales per Paying User: Indicates average revenue per user who makes a purchase, calculated by Total Sales / Number of Paying Users.
Part 3 - Navigating Filters in Apple App Store Connect
Diving deeper into App Store Connect's analytics, filters emerge as a powerful feature, allowing you to slice data across various dimensions for more nuanced insights. Here, we focus on one of the most critical dimensions: Traffic Source Types, which sheds light on how users discover your app.
Key Dimensions for Filtering
App Version & Device: Understand performance across different app versions and devices.
Product Pages & Region: See how your app fares in various locales and on different product pages.
Campaign: Track the effectiveness of your marketing campaigns.
Traffic Source Types – A Closer Look
App Store Search: This includes views and downloads stemming from App Store searches, including Search Ads.
App Store Browse: Reflects user interactions while browsing sections like Today, Games, or Apps.
App Referrer: Tracks users coming from links in other apps, excluding Safari but including Apple apps like Messages.
Web Referrer: Captures users who arrive at your product page via web links, with the last URL before the App Store page being counted.
Sub-dimensions like "App Referrer" and "Web Referrer" offer further granularity, especially in understanding the role of external referrals in driving traffic to your app.
By leveraging these filters, especially Traffic Source Types, you can better understand user acquisition channels, informing your ASO and UA strategies with targeted insights. In the next parts, we'll explore how to apply these insights for optimizing your app's performance on the App Store.
Connect your App Store data to Looker Studio and BigQuery today. See how here.
Part 4 - Analyzing Data in the "Metrics" View of App Store Connect
In this section, we'll navigate the "Metrics" tab within App Store Connect's App Analytics, providing a practical guide on how to dissect your app's data effectively. Accompanied by screenshots, we'll walk through accessing the tab, utilizing filters, and interpreting the results to inform your ASO and UA strategies.
Step-by-Step Analysis Using the "Metrics" Tab
1 - The journey begins with navigating to App Analytics, where we'll select the "Metrics" tab.
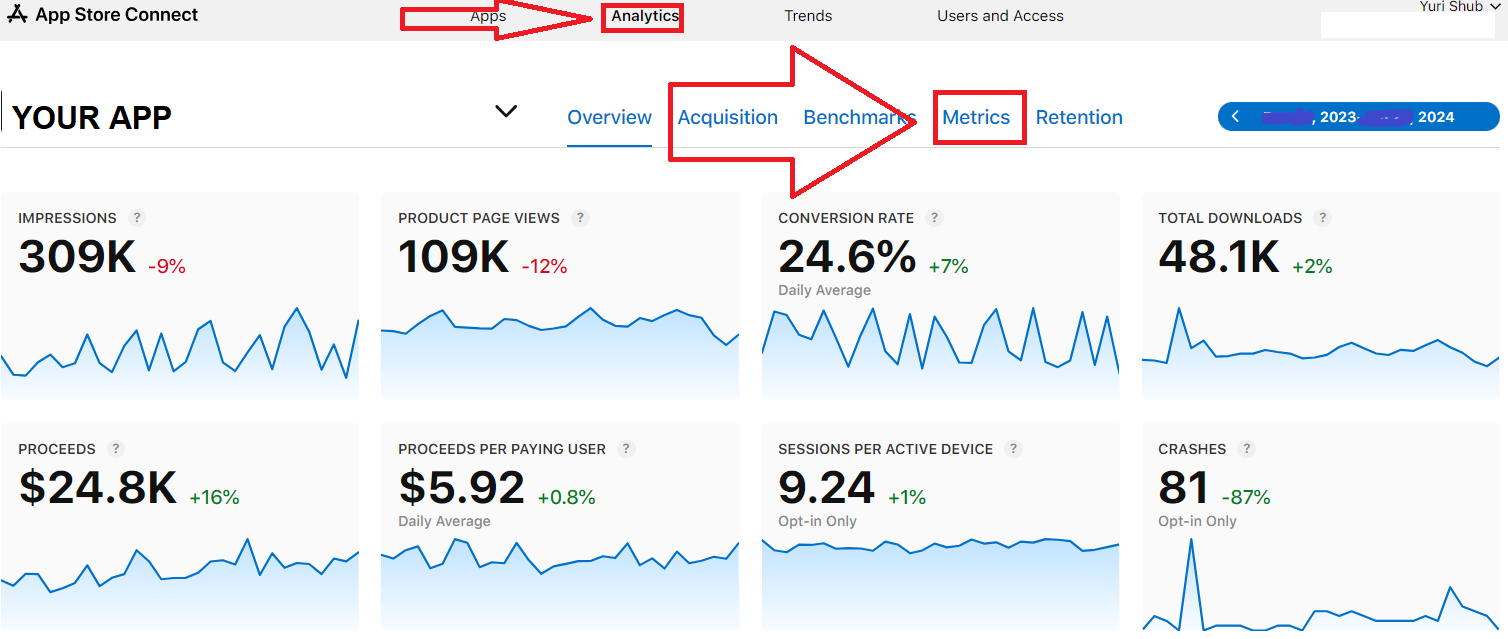
2 - Upon entering the "Metrics" view, you'll be greeted with options to select time frames and various metrics.
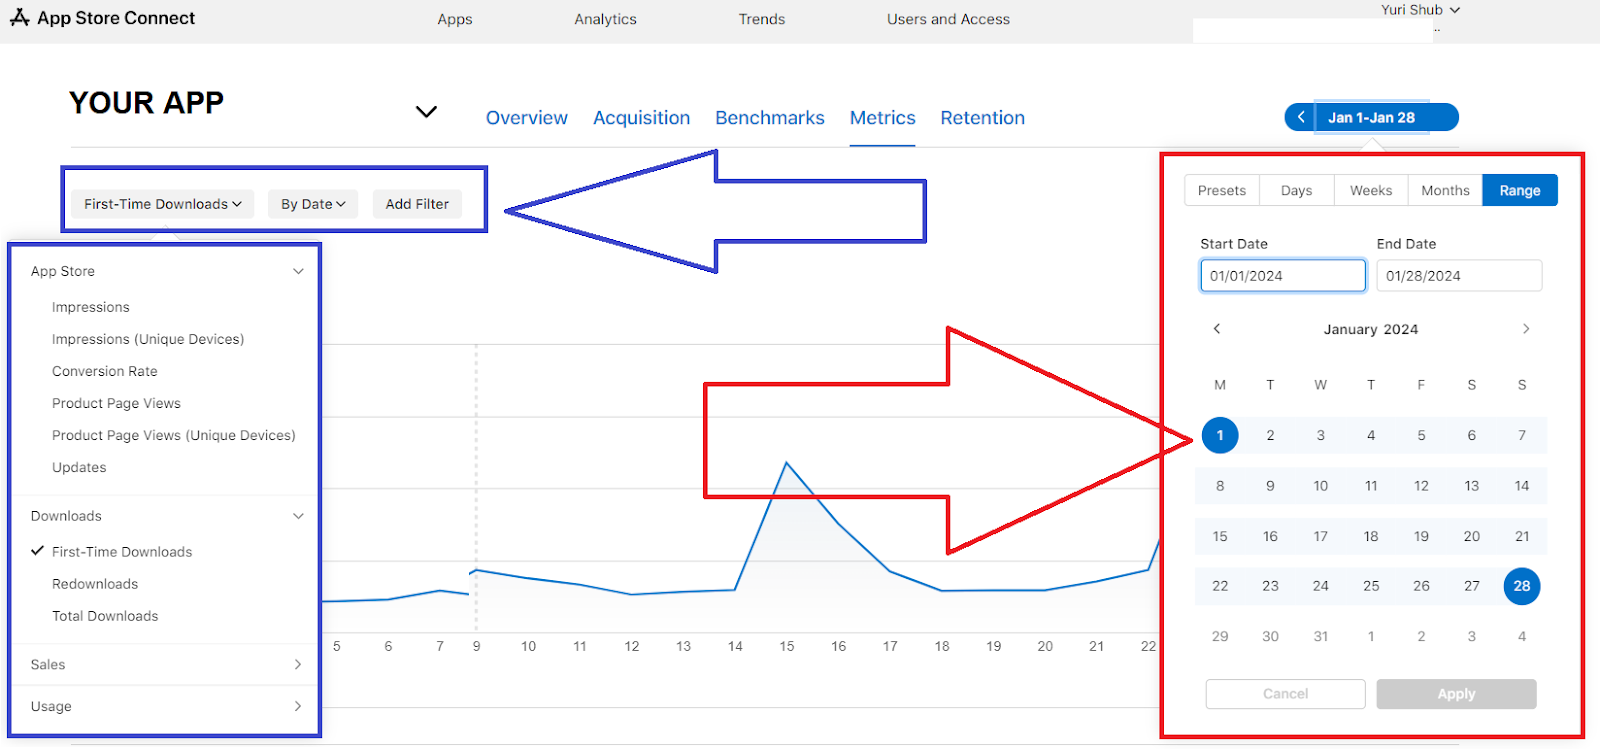
3 - Next, we delve into dissecting your chosen metrics by dimensions such as traffic source types or region.
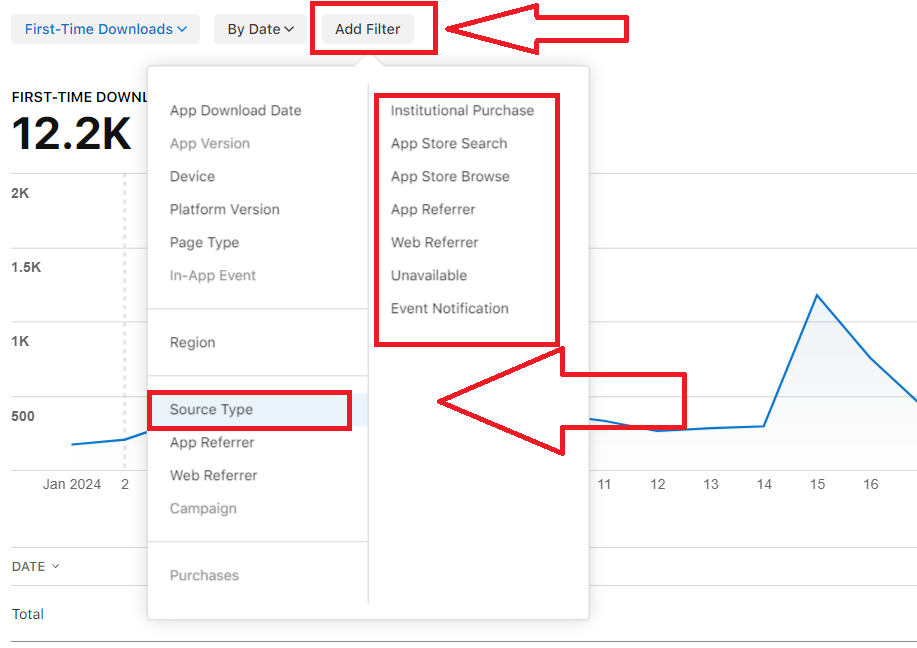
4 - We'll employ "app referrer" and "web referrer" filters to pinpoint the exact sources driving traffic to your app.
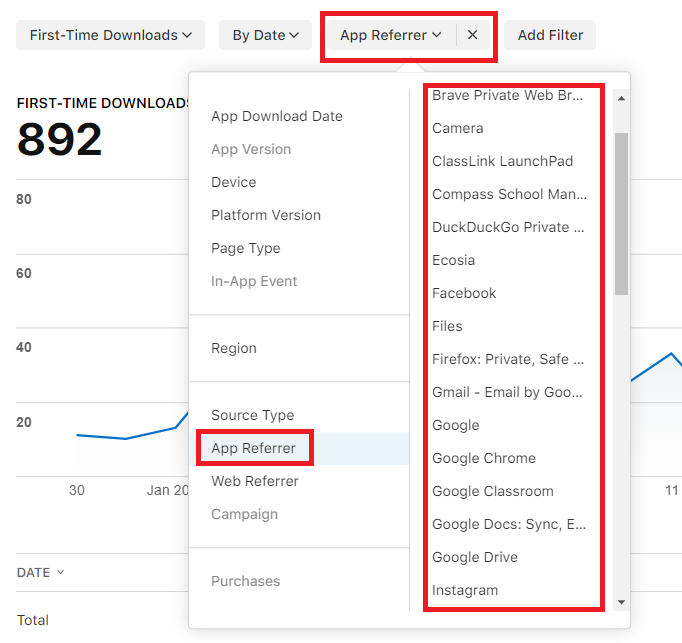
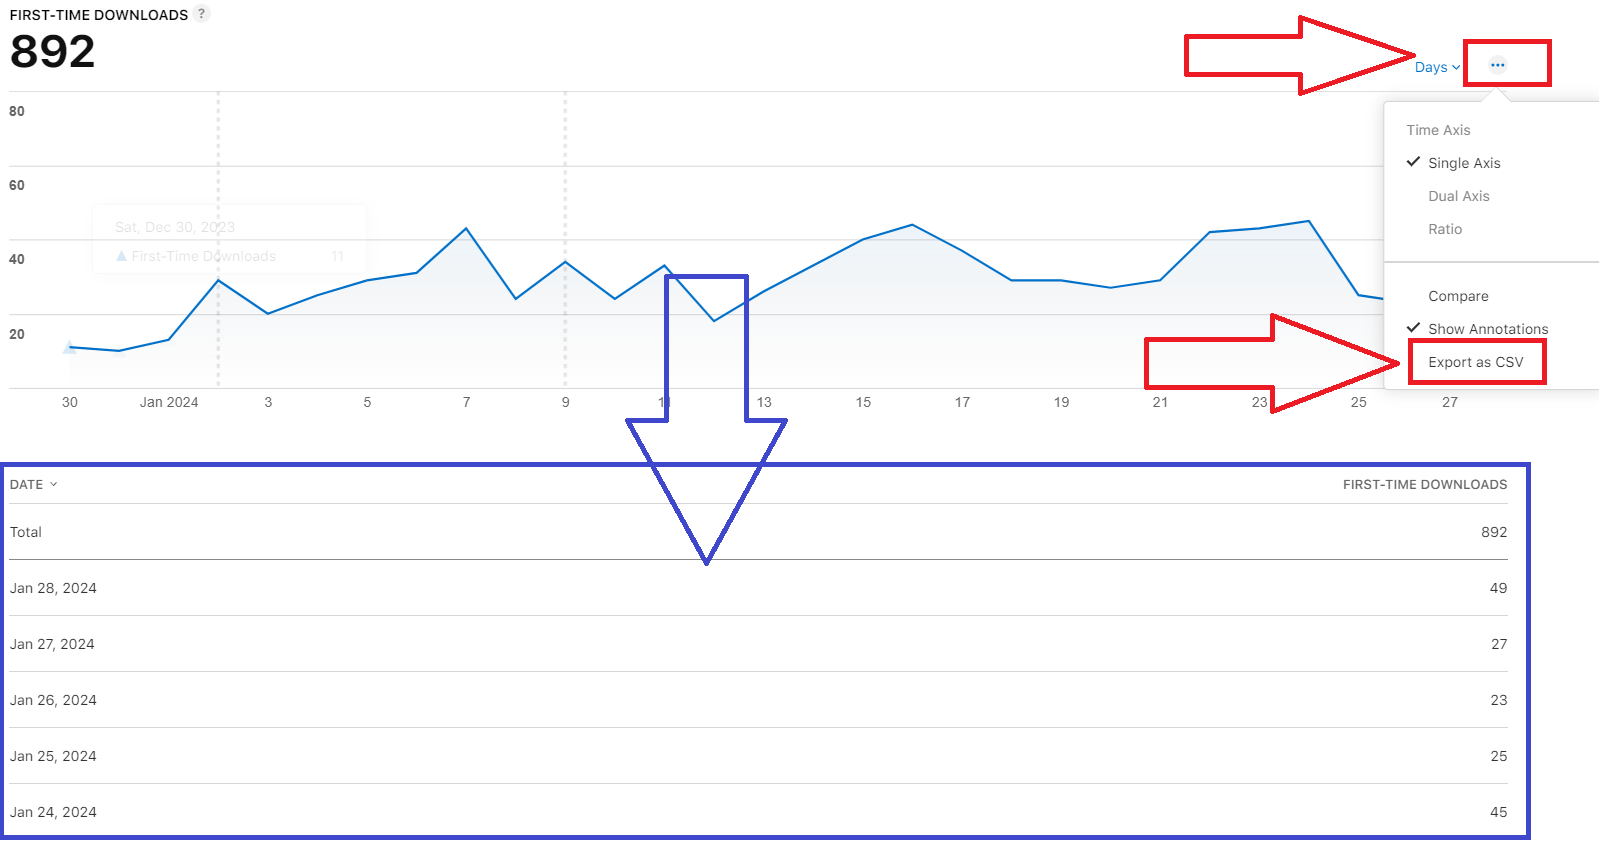
5 - Finally, we explore how to interpret the displayed data, both in graph and table formats, or even export it.
Easy App Reports is the only platform to offer data from App Store Analytics in compliance with the App Store Guidelines. Get started today.
Part 5 - Exploring Different Views in App Store Connect App Analytics
App Store Connect App Analytics offers a suite of views, each tailored to provide unique insights into your app's performance. After diving into the "Metrics" view, let's broaden our understanding by exploring other available views, culminating in a detailed look at the "Benchmarks" view.
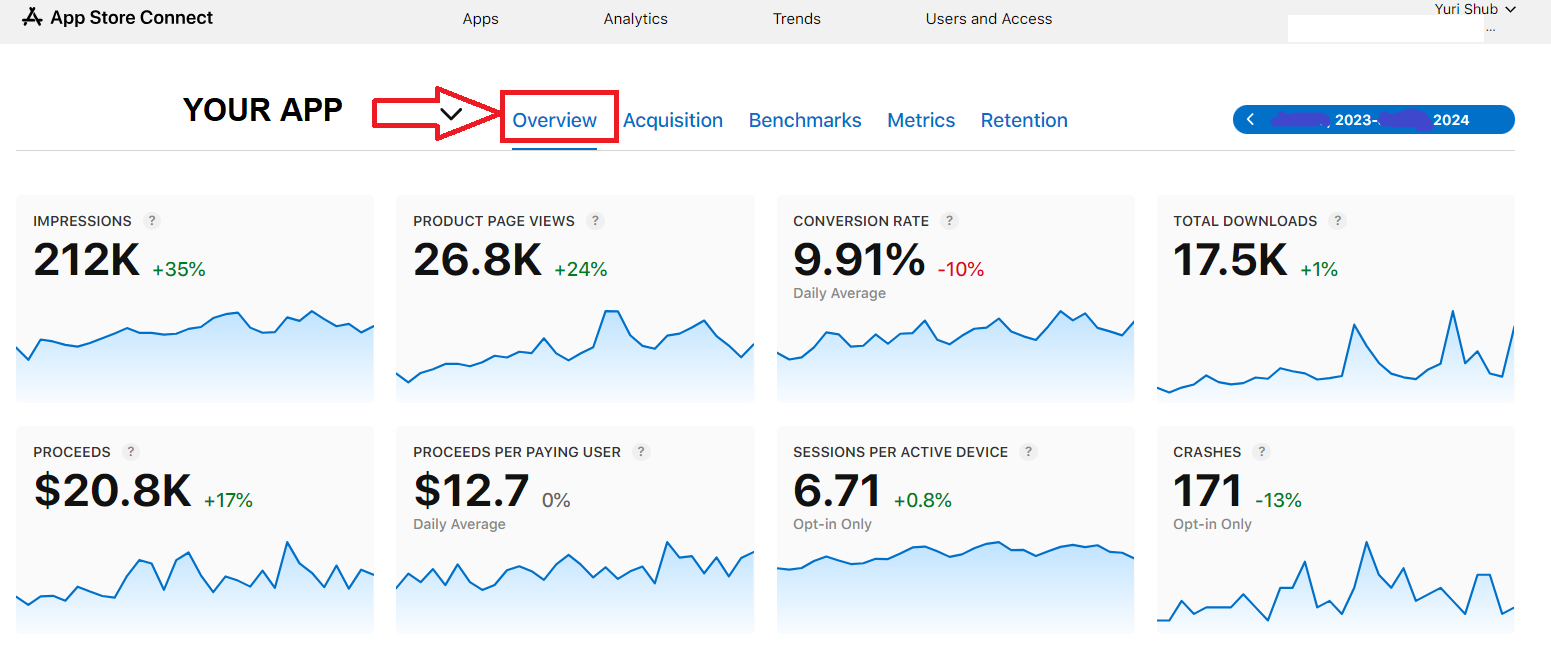
The Overview: This is your dashboard, offering a snapshot of essential metrics and trends at a glance. It's ideal for a quick check-up on your app's general health.
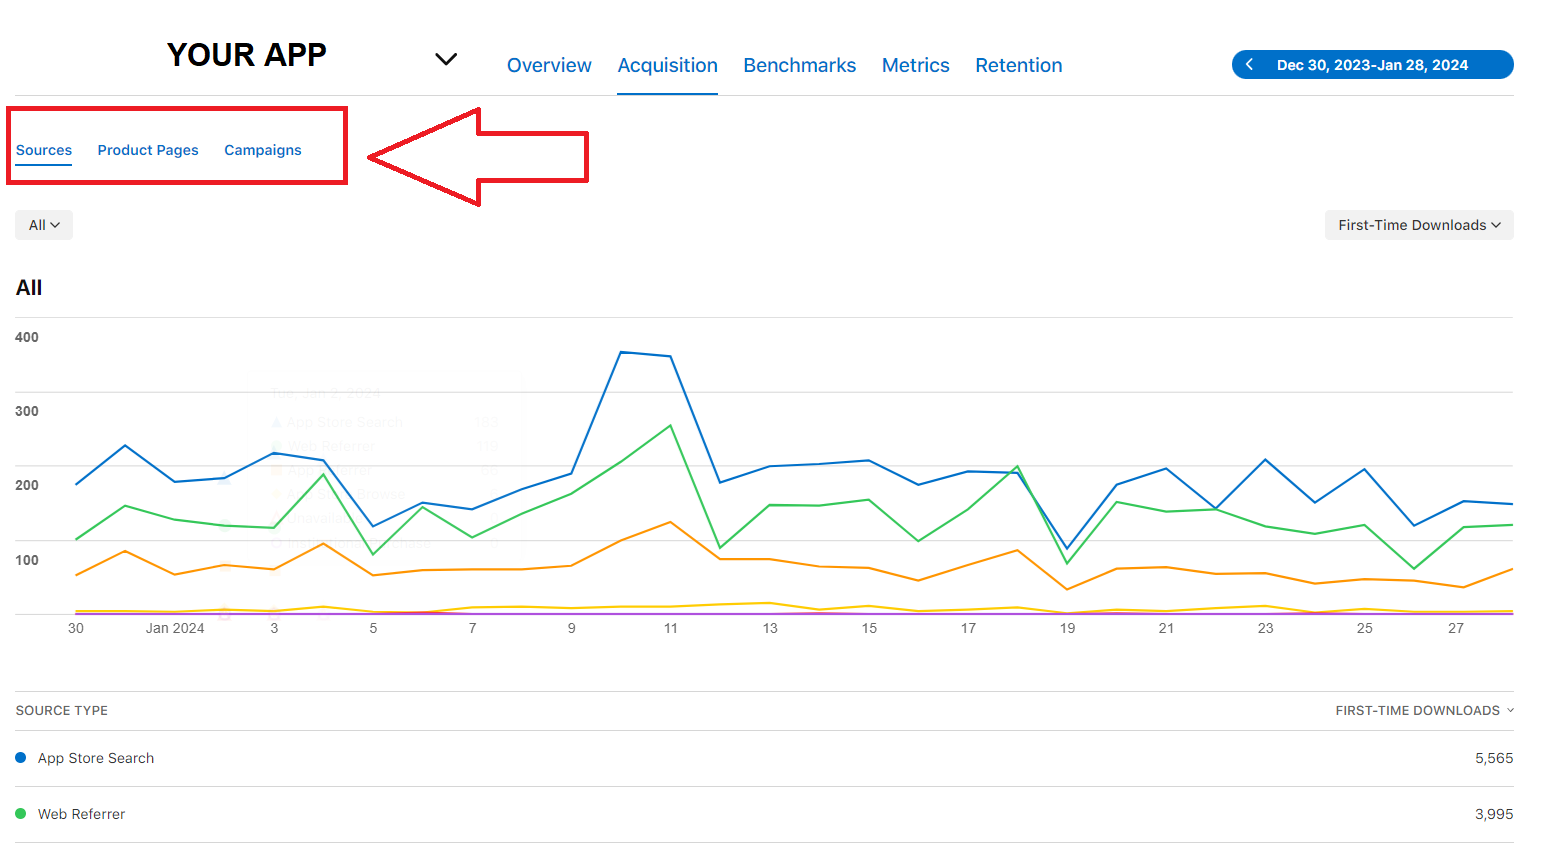
Acquisition View: Here, you can visually dissect metrics by traffic source type, crucial for understanding how users discover your app. It also allows for in-depth analysis of marketing campaign performances, particularly useful for evaluating the effectiveness of campaign links generated within App Store Connect.
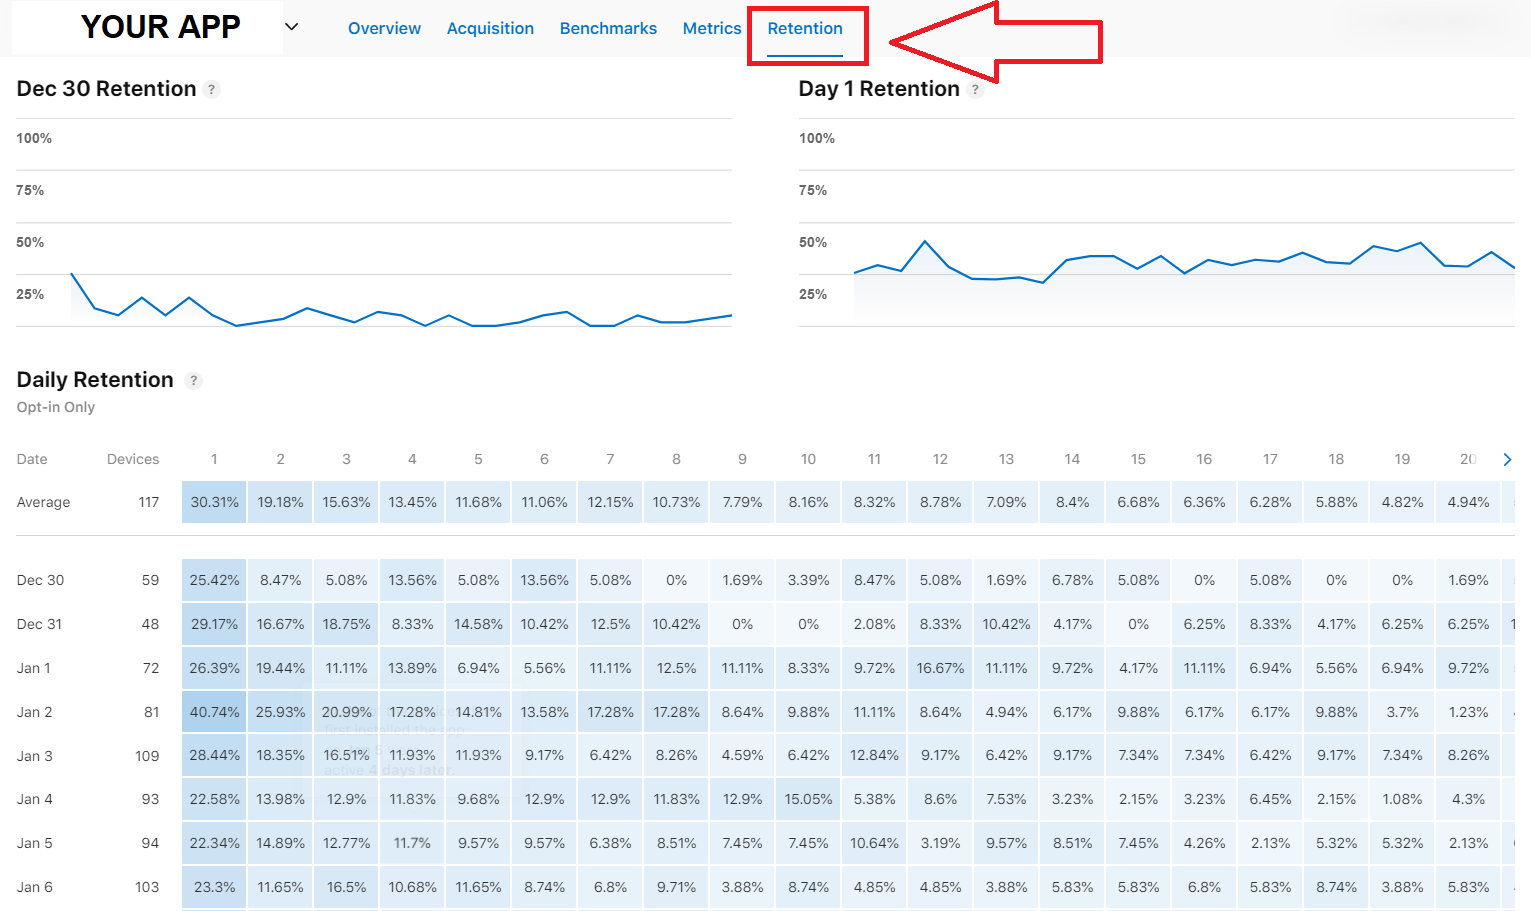
Retention View: Focused on measuring user engagement over time, this view shows how well your app retains users after their initial download. You can analyze retention rates for various periods, providing insights into long-term user behavior and app stickiness.
Deep Dive into the Benchmarks View
The "Benchmarks" view stands out by offering a comparative analysis of your app against similar apps in your category. This peer comparison is invaluable for contextualizing your app's performance within the broader app ecosystem.
Peer Group Benchmarks: Benchmarks are calculated across key metrics such as conversion rate, retention rates (Day 1, Day 7, Day 28), crash rate, and average proceeds per paying user. These metrics are aligned with standard App Analytics metrics, ensuring consistency in your analysis.
Benchmarking Criteria: Peer groups are formed based on several attributes:
- App Store Category: Your app is compared with others in the same category or categories, depending on your app's classification in App Store Connect.
- Business Model: Apps are grouped by their monetization strategy, including free, freemium, paid, paymium, and subscriptions. This classification helps in comparing your app with others that share a similar revenue model.
- Download Volume: Apps are also benchmarked against others with similar download volumes, categorized into low, medium, and high tiers. This volume is relative, meaning your app might rank differently in various peer groups.
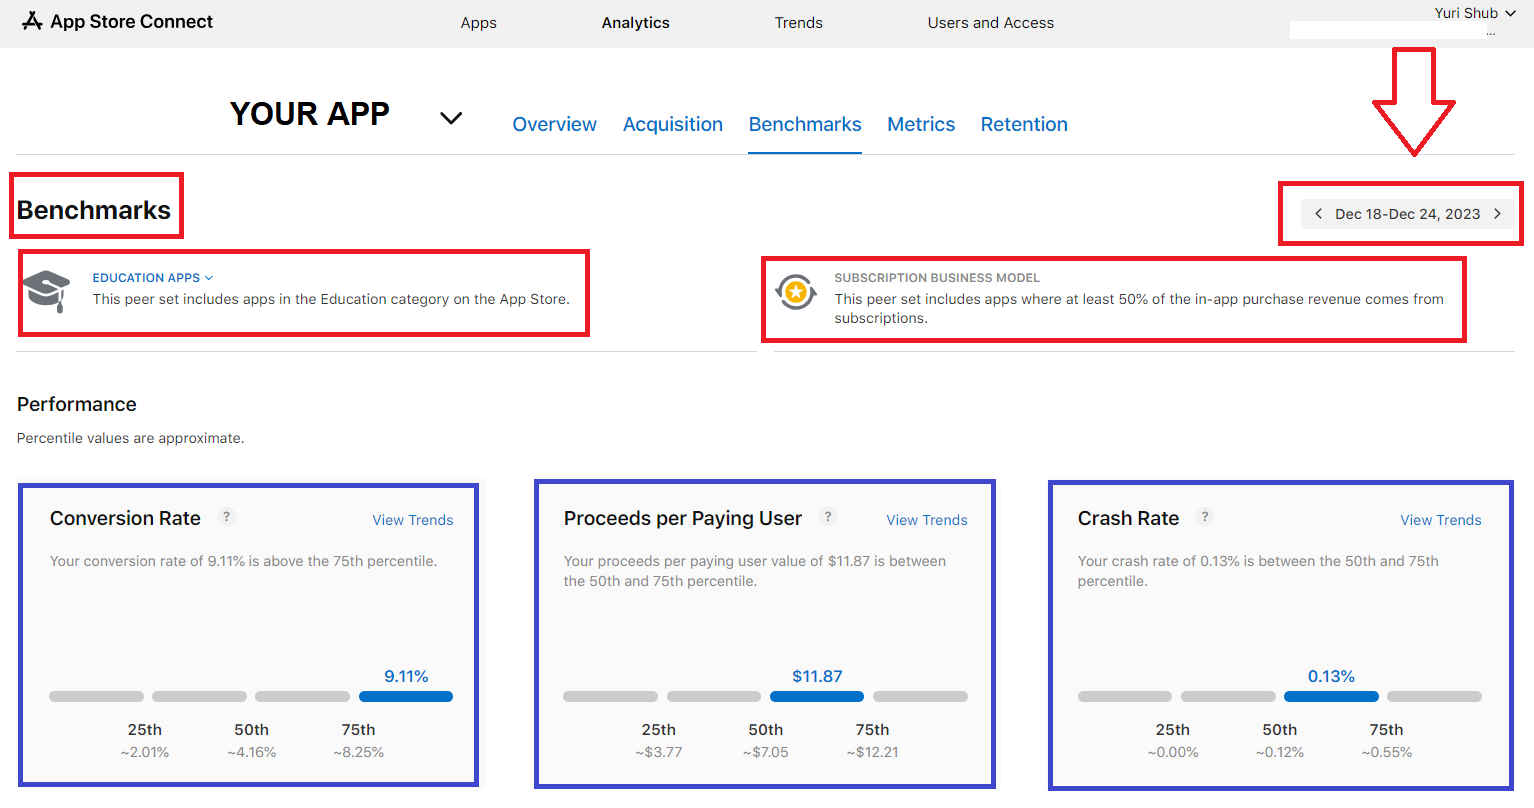
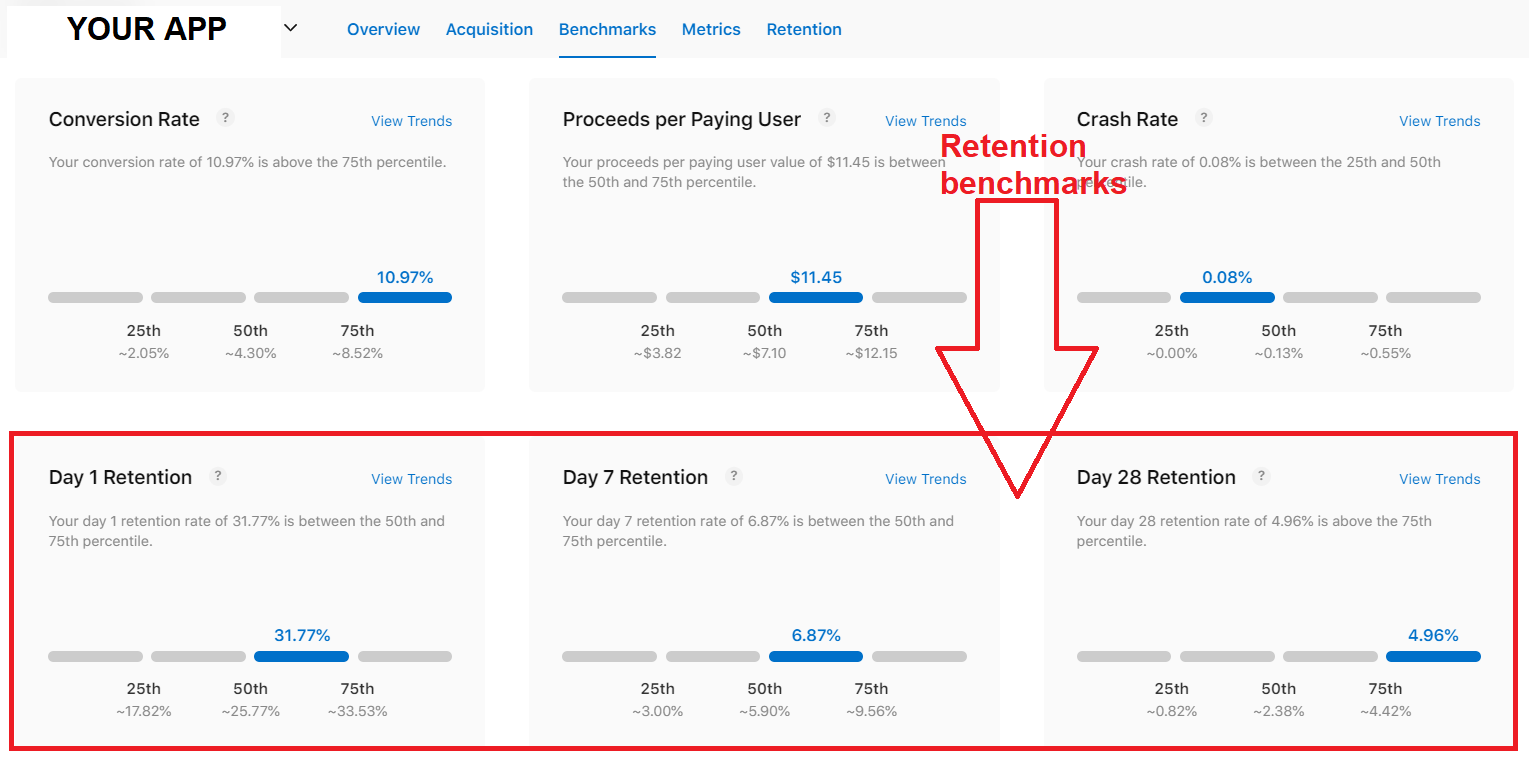
Analyzing Benchmarks: Within the "Benchmarks" tab, you can select specific categories and view your app's performance percentile (25%, 50%, 75%) against peers. This analysis helps identify areas where your app excels or needs improvement compared to the average or top-performing apps in your category.
Retention Metrics in Benchmarks: The view also includes retention metrics, allowing you to see how your app's user engagement over time compares to similar apps. This includes early retention (Day 1) and extends to longer-term retention (Day 7 and Day 28).
By utilizing the "Benchmarks" view, you can comprehensively understand where your app stands in its competitive landscape. This insight is crucial for strategic planning and optimization efforts, aiming to elevate your app's performance in key areas relative to its peers.
Easy App Reports is the only platform to offer data from App Store Analytics in compliance with the App Store Guidelines. Get started today.
About the Author
Yuri Shub is a mobile app growth consultant specializing in mobile app growth strategy, ASO, and User Acquisition. He founded Topanda, a marketing agency focused on these areas.