
How to Integrate Your App Store Data into Looker Studio with the Easy App Reports Connector
Introduction
The mobile app landscape is vast and ever-expanding. To stay ahead of the competition, it's crucial that you have easy, quick access to your App Store data. Enter the Easy App Reports connector. In this article, we'll explore how you can use this innovative tool to integrate your App Store data into Looker Studio and why this integration is indispensable for any app developer or marketing professional.
Part 1: What is the Easy App Reports Connector?
The Easy App Reports Connector is a comprehensive solution that allows you to connect your App Store account to Looker Studio. With it, you can access and view your App Store data in an organized manner, making it easier to analyze and track key metrics. Plus, Easy App Reports prides itself on being the only solution in the market that offers both Trends and Analytics reports.
Part 2: Why use the Easy App Reports Connector?
With the Easy App Reports connector, the task of analyzing your app data becomes much simpler and efficient. Instead of dealing with constant CSV exports, the connector automatically imports data from all apps under your Apple and Google developer accounts. Moreover, the integration ensures your data is updated daily as soon as Apple and Google publish it on their APIs.
Part 3: How to integrate your App Store data into Looker Studio?
To integrate your App Store data into Looker Studio, you'll first need an active subscription of Easy App Reports and account-holder access to App Store Connect.
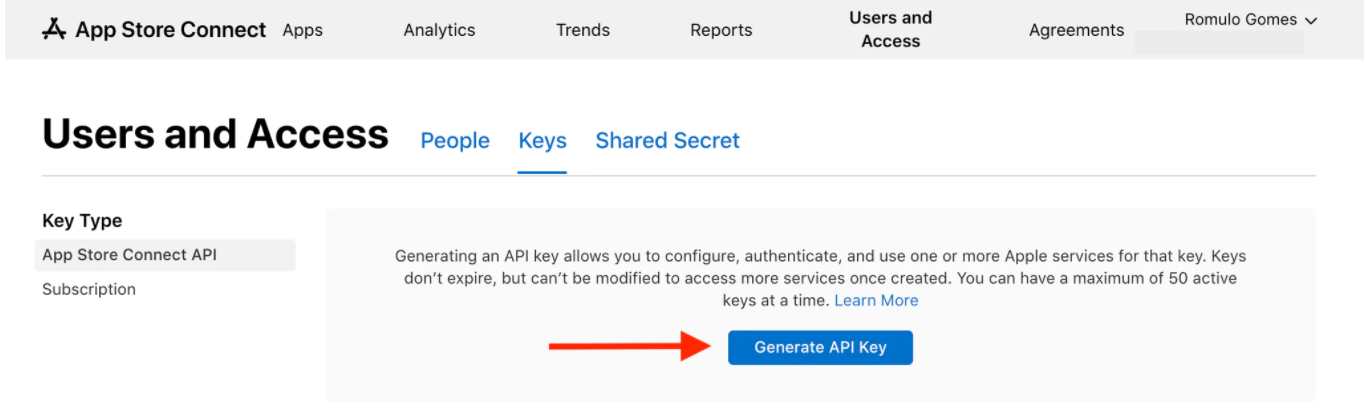
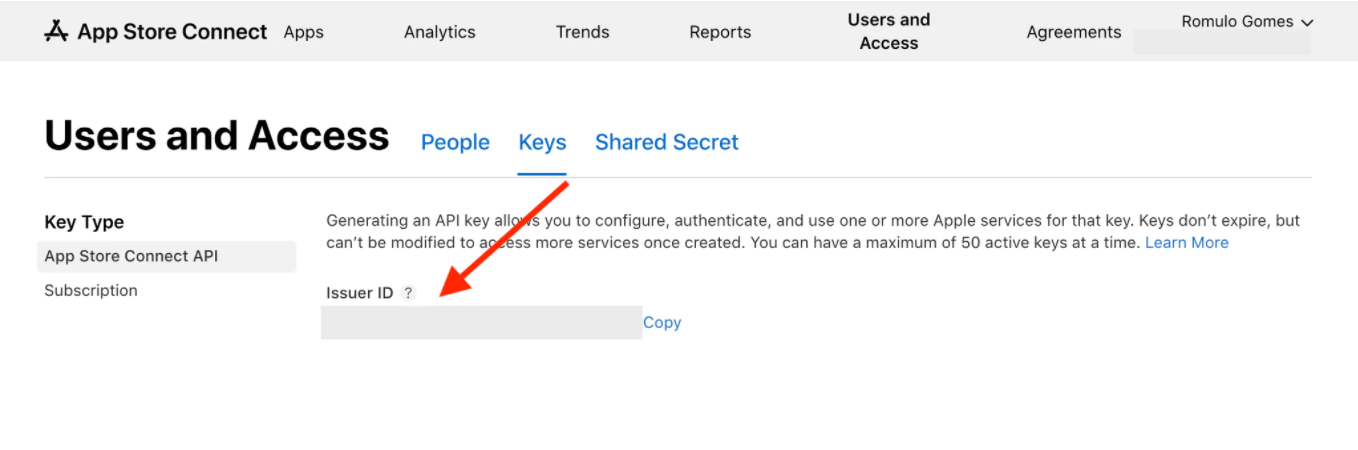
- Open App Store Connect and log into your account. Go to "Users and Access" and click on Generate API Key.
- Set a name for your API key and give it "App Manager" and "Sales and Reports" access.
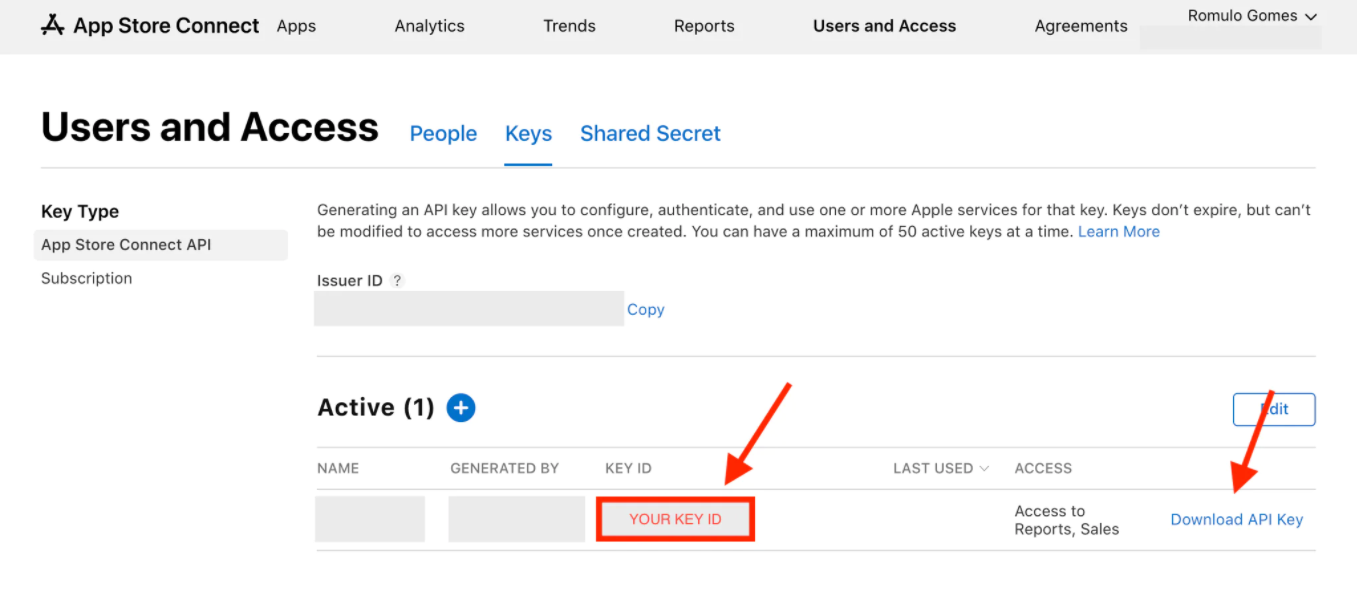
- Now you can copy your Key ID and download your API Key.
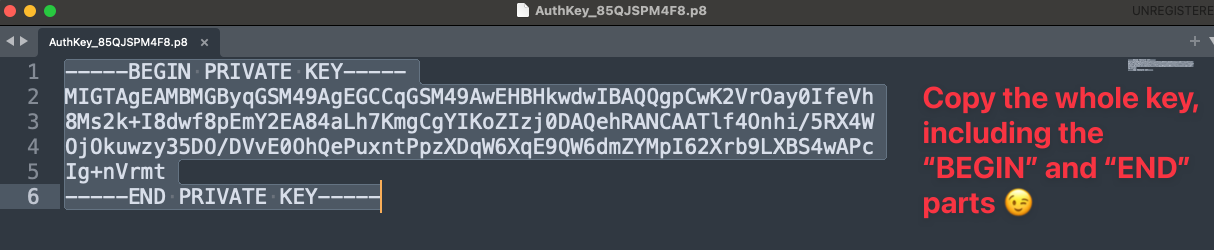
- Open the API key file using a text editor to find your Auth key.
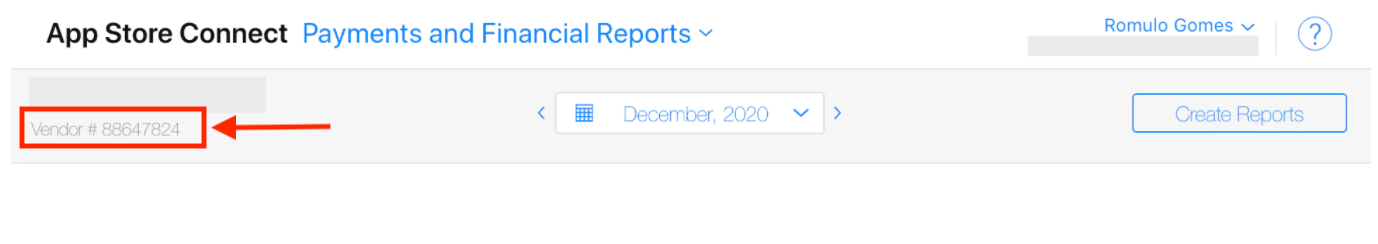
- The Issuer ID should be visible on the same page, and the Vendor ID is available on your Payment and Financial Reports page.
- Next, go to https://app.easyappreports.com/ and add your Key ID, Issuer ID, Vendor ID, and Auth Key exactly as they are.
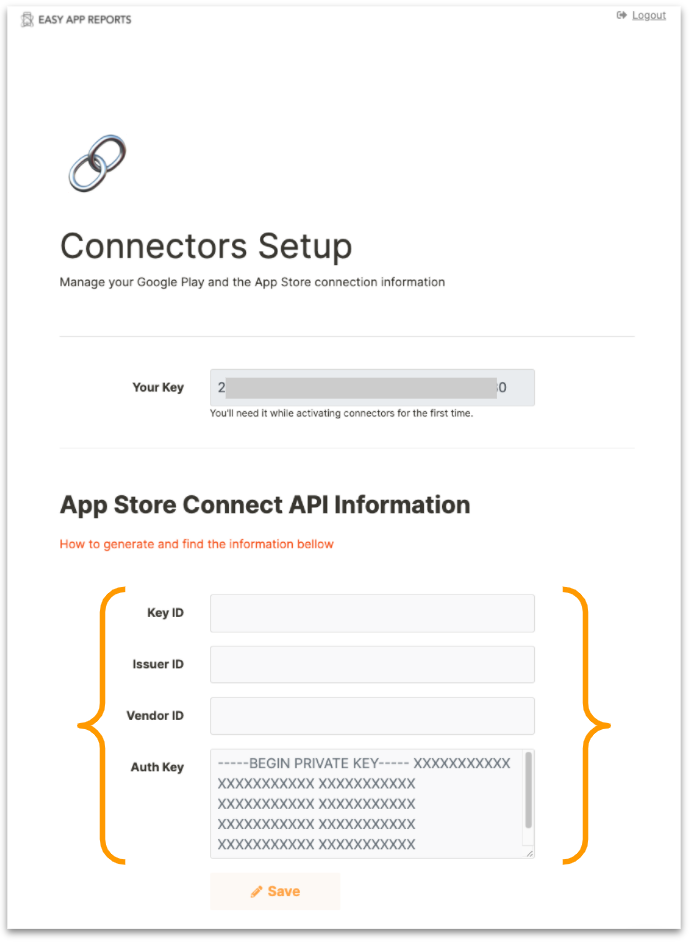
IMPORTANT: don't remove the "-----BEGIN PRIVATE KEY-----" and "-----END PRIVATE KEY-----" from the Auth Key field.
- Once these details are entered, you can access Looker Studio, where you will need to open and authorize the connector. You can go directly to the connector through this link
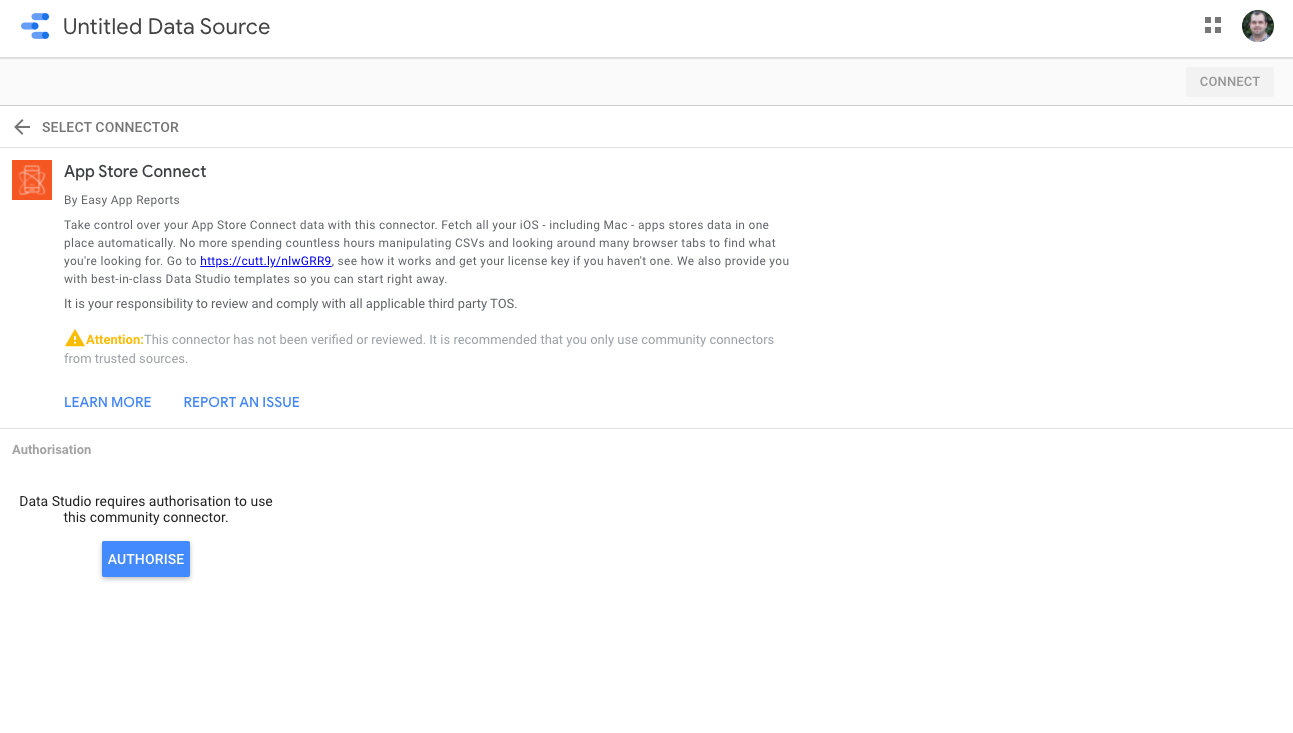
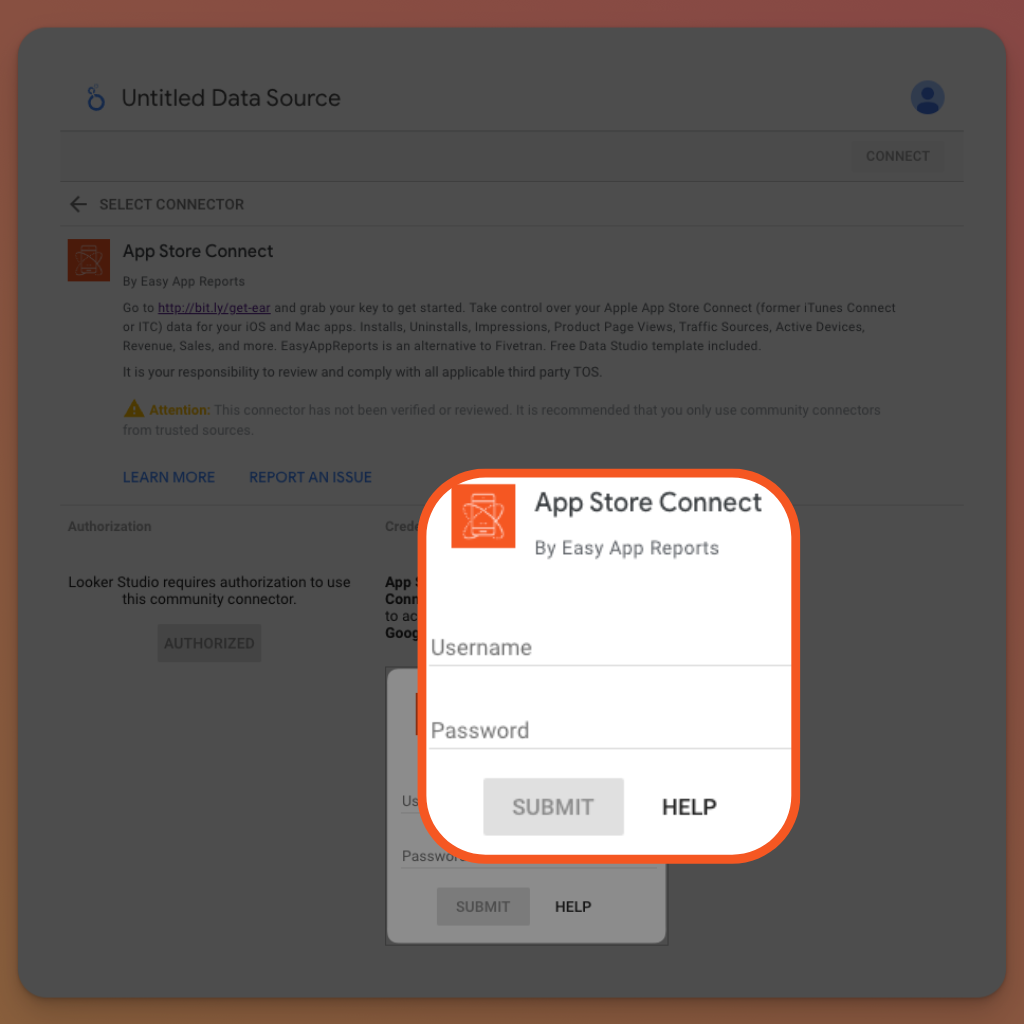
- Great! Now you are connected and ready to start creating your dashboard or leverage pre-built templates.
Part 4: Building Your Dashboard on Looker Studio
Building a dashboard on Looker Studio using the Easy App Reports connector is a seamless process. This tool offers a high degree of flexibility, allowing you to construct your dashboard exactly how you want it. Here's how you can create a report from scratch, focusing on tracking app downloads:
Step 1: Log in and Add the Data Source
Open Looker Studio and log in with your username and password. At your home page, click "Create" and then select "Data Source". Type "Easy App Reports" in the search bar and select "App Store Connect". You can also access Easy App Reports’s App Store Connector directly on Looker Studio.
Step 2: Connect the Report and Create a New Report
Click "Create" and then "Report". Here you can select the type of report you want to connect. For monitoring app downloads, you would typically use the "Trends" report that is fed by the Apple's official API. If you want further information on the types of report you can integrate, head down to Part 5 of this article.
Once you have connected your report, save your connection with the report type you chose. This will allow you to build a multi-reports dashboard with Trends, Analytics, and Reviews using our templates.
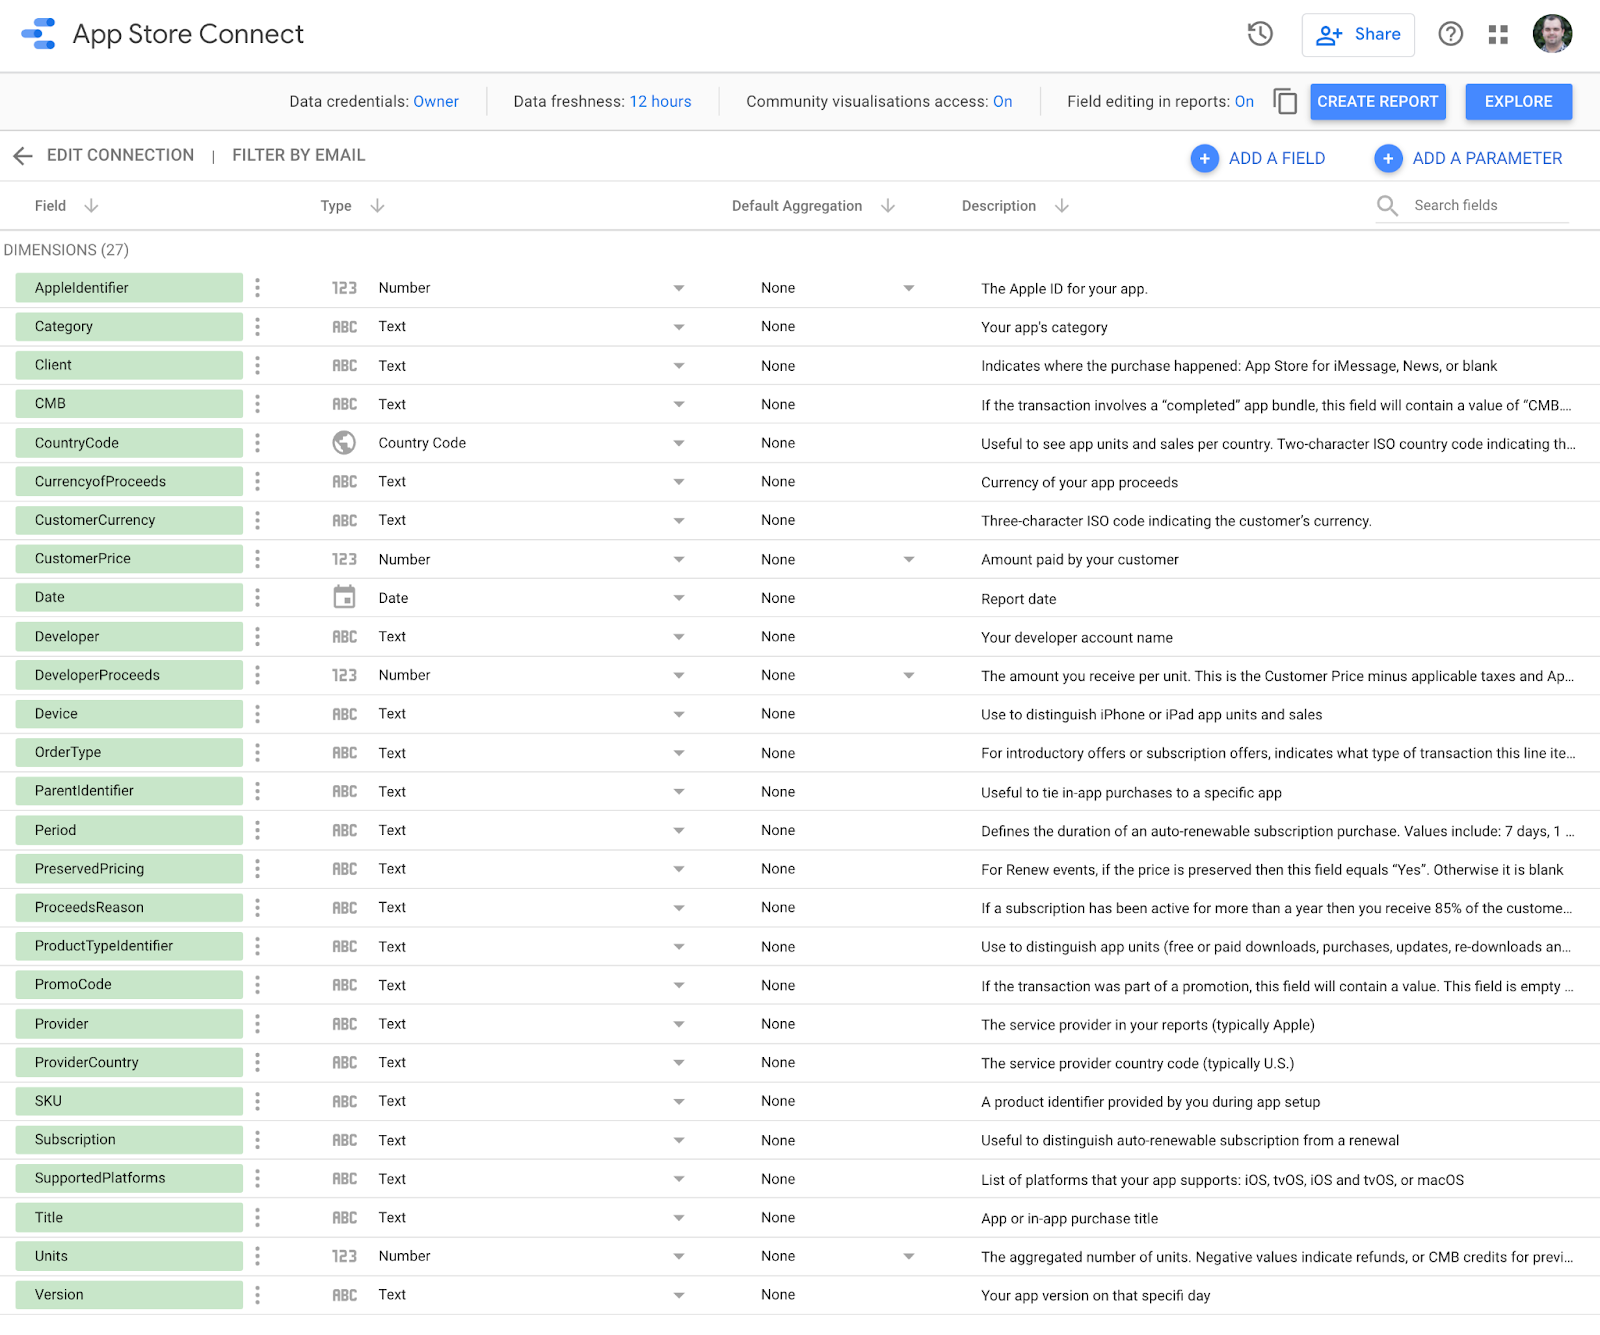
Step 3: Select the Relevant Dimensions and Metrics
In the context of tracking app downloads, you would want to select relevant metrics and dimensions. Under metrics, choose "Units" as this metric by Apple covers everything from Updates, App Installs, Re-downloads, to In-App Purchases Sales. For the dimensions, add ‘Title’ and split by the ProductType Name. You can further refine your analysis by adding other dimensions such as 'Region' or 'Device' based on your needs.
Step 4: Filter and Sort your Data
Once you have selected the right metrics and dimensions, you can apply filters to narrow down your data. For example, if you are only interested in downloads for a specific time period, you can set a date filter. Once your data is filtered to your liking, you can sort it to get a better understanding of your app's download trends.
Step 5: Visualize your Data
Finally, Looker Studio allows you to choose from a variety of chart types to visualize your data. For tracking downloads, a line chart or a bar chart might be suitable to see the trend over time.
Step 6: Save your Report
Don't forget to save your report for future reference. You can even schedule regular email deliveries of your report right from Looker Studio, keeping you updated without the need to manually check the numbers.
This detailed and tailored approach to data analysis not only gives you insights on how many downloads your app has but also offers a comprehensive view of trends and patterns that can guide your decision-making process.
Part 5: Understanding and Integrating Different Reports
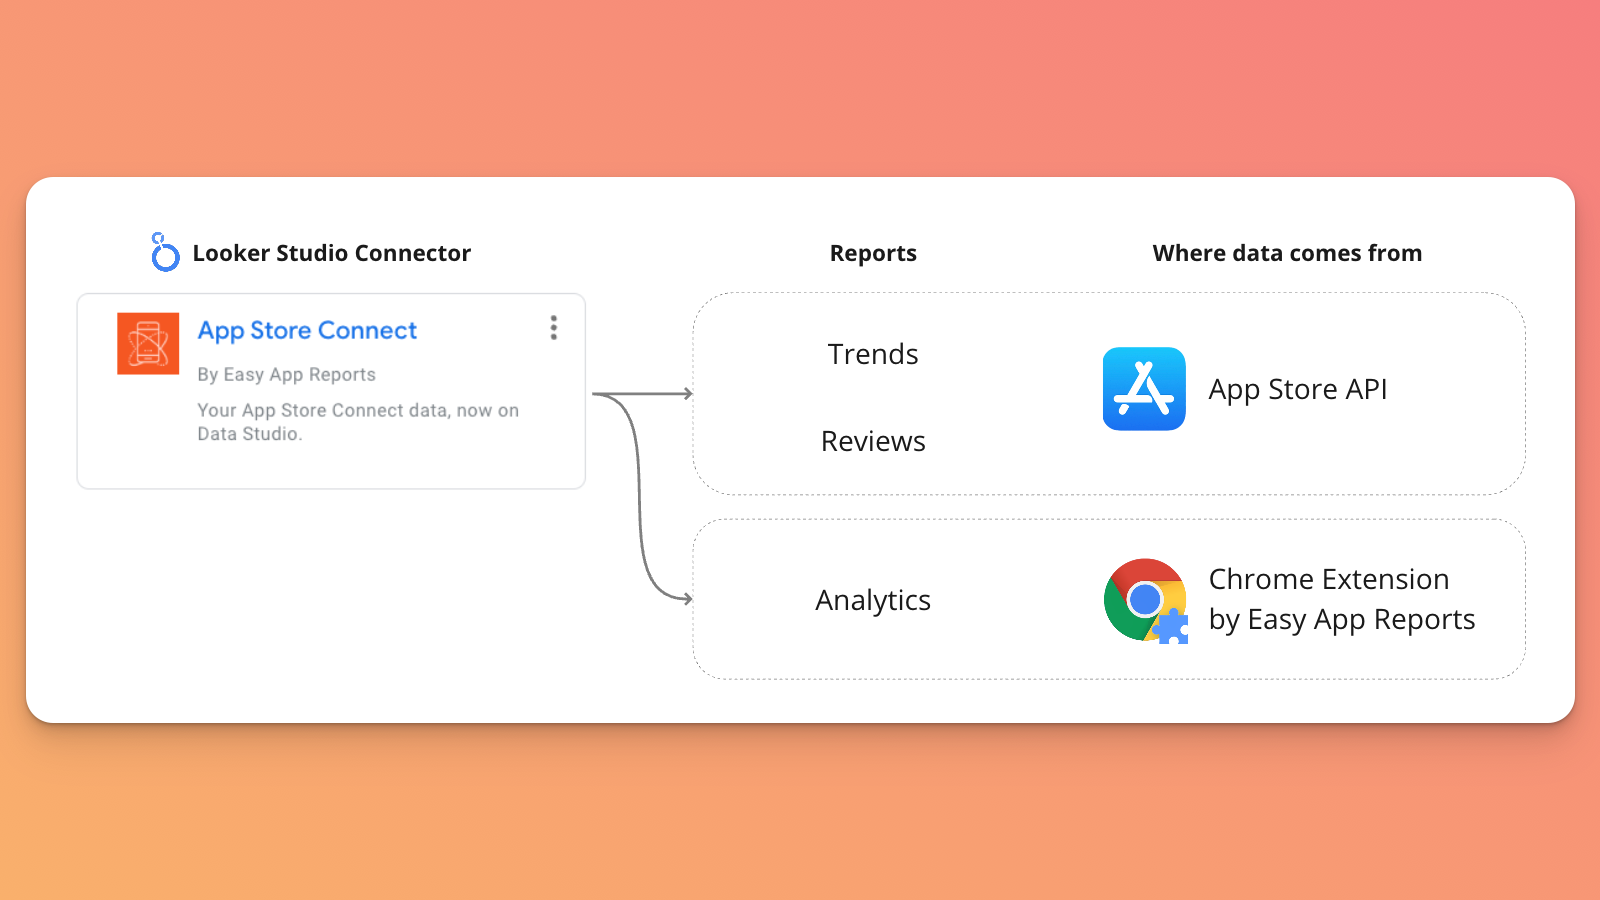
The Easy App Reports connector supports various reports including Trends, Analytics, and Reviews. Each report provides unique insights and understanding how to integrate each one will allow you to get the most out of your data.
Trends Report:
The Trends report, fed by Apple's official API, provides information on your app's sales and trends. To integrate it, select "Trends" when you're creating your report. This data allows you to track key metrics over time, helping you identify patterns and inform your decision-making.
Analytics Report:
The Analytics report, fetched via the Easy App Reports Chrome Extension, offers data that Apple doesn't make available on their API, such as impressions, product page views, and deletions. To incorporate this data, select "Analytics" when you're adding a new data source in Looker Studio. More on the setup instructions here. This detailed information can provide deeper insights into your app's performance and user behavior.
Reviews Report:
The Reviews report also comes from Apple's official API and provides crucial feedback from users about your app. To include this data in your dashboard, select "Reviews" when you're connecting your report in Looker Studio. User reviews are invaluable for understanding your audience's needs and improving your app based on their feedback.
Part 6: Making The Most Of Easy App Reports Connector
Beyond just integrating your App Store data into Looker Studio, the Easy App Reports Connector offers several other features that add further value to your data analysis:
Built-in Data-Privacy:
The connector ensures your data is GDPR and CCA compliant, allowing you to work confidently and securely. More info about it's security and privacy can be found on this page.
Import Data from Multiple Apps:
Data from all apps under your Apple and Google developer accounts are automatically imported, enabling comprehensive analysis across your portfolio.
Automatic Updates:
Your data is updated daily as soon as Apple and Google publish it on their APIs, keeping your analysis timely and accurate.
Historical Data Access:
Even after Apple archives your data, Easy App Reports stores it, offering a valuable long-term analytical advantage.
Conclusion
Integrating your App Store data into Looker Studio with the Easy App Reports connector is a straightforward process that can significantly enhance your app data analysis, making it a vital tool for measuring your App’s success. From tracking app downloads to understanding user behavior and feedback, the connector equips you with powerful insights to guide your decision-making, simplifying the task of app data analysis. So why wait? Start leveraging the power of your app and elevate your analytical game data with Easy App Reports today!